- Analýza
- Technická analýza
EUR/USD Technická analýza - EUR/USD Obchodování: 2015-07-20
EUR/USD currency pair sustains the trend
Let us consider the EUR/USD currency pair on the H4 chart. At the moment we observe a continuing bearish trend, determined by the eurozone crisis and the technical default in Greece. The price has breached the important support line at 1.09186 and successfully consolidated below this level. The mark now acts as a resistance line. Donchian Channel confirms the major trend. RSI-Bars assures our assumptions as well. However, we see a slight rebound.
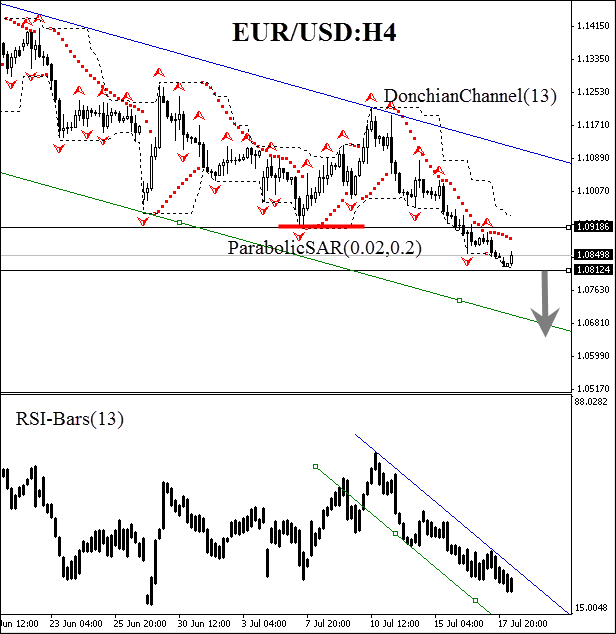
We believe that all the represented analysis tools have been giving bearish signals. Conservative traders are recommended to wait until the next support line is crossed at 1.08124. This mark is supported by the Donchian Channel lower boundary. We can place a sell pending order there. A stop loss may be placed at the Donchian opposite boundary at 1.09186. This level is confirmed by Parabolic historical values and Bill Williams fractal. The stop loss is supposed to be moved every four hours to the next fractal high, following Parabolic signals. Thus, we change the probable profit/loss ratio to the breakeven point.
| Position | Sell |
| Sell stop | below 1.08124 |
| Stop loss | above 1.09186 |
- Získejte Certifikát

Poznámka:
Tento přehled má informativně poznávací charakter a publikuje se zdarma. Všechny údaje, uvedené v přehledu, jsou získány z otevřených zdrojů, jsou uznávány více méně spolehlivé. Přitom, neexistují žádné garance, že uvedená informace je úplná a přesná. Přehledy se v budoucnu neobnovují. Veškerá informace v každém přehledu, včetně názorů, ukazatelů, grafů, je pouze poskytována a není finančním poradenstvím nebo doporučením. Celý text nebo jeho jakákoliv část a také grafy nelze považovat za nabídku provádět nějaké transakce s jakýmikoliv aktivy. Společnost IFC Markets a její zaměstnanci za žádných okolností nemají žádnou odpovědnost za jakékoli kroky učiněné kýmkoliv po nebo v průběhu seznámení s přehledem.
