- Analýza
- Technická analýza
Akciový index Financí Technická analýza - Akciový index Financí Obchodování: 2019-02-11
World central banks lower economic growth forecasts
In this review, we suggest considering the personal composite instrument (PCI) “Financial Stock Index”. It reflects the price dynamics of the stock portfolio of 10 largest companies from the US finance industry, which are traded on New York Stock Exchange (NYSE). Will the Finance_Stocks fall?
The Federal Reserve Bank of New York lowered its forecast for the US GDP growth in 2018 to 2.4% from 2.6%, as well as the forecast for GDP in the first quarter of 2019 to 2.2% from 2.4%. Data on economic growth over the past year will be published on February 28, 2019. Its possible slowdown may lower the likelihood of the Fed rate hike and have a negative impact on stocks of the financial sector. The next Fed meeting will be held in late March. Let us recall that earlier the ECB and the Bank of England reduced GDP growth forecasts for their countries. More than half of the companies from the list of the S&P 500 stock index have already published earnings reports for the 4th quarter of 2018. Market participants slightly lowered the estimate of the quarterly growth in the total profit of the S&P 500 to + 5.1% from + 5.3% expected before the start of the reporting season.
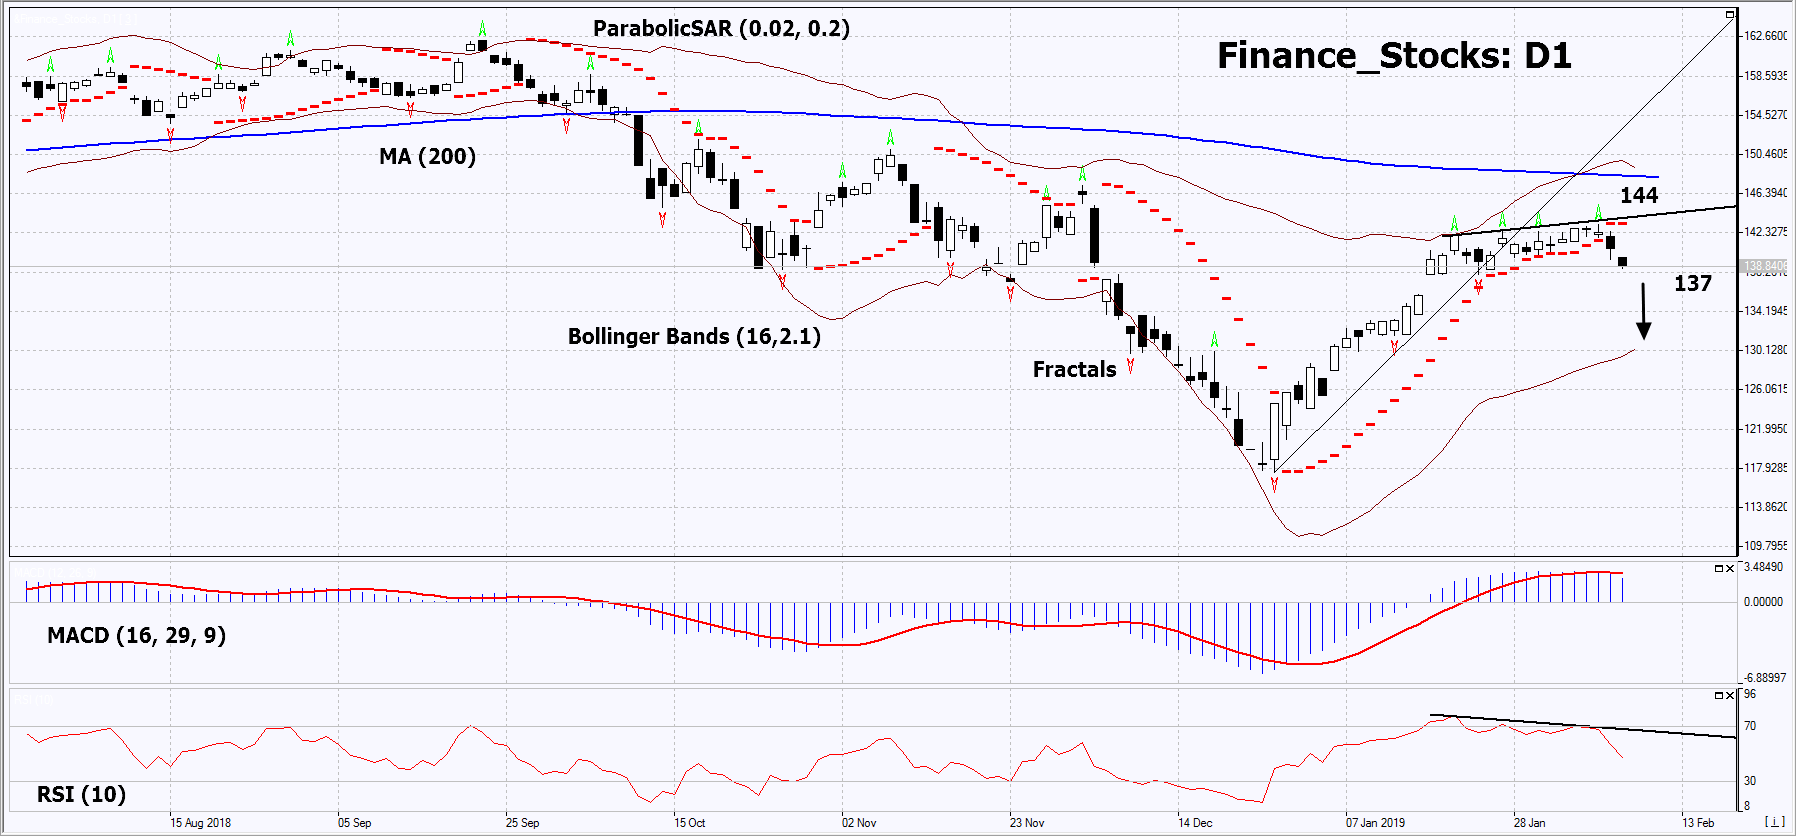
On the daily timeframe, Finance_Stocks: D1 moved from the rising trend to the neutral one. A number of technical analysis indicators formed sell signals. It is possible in case of the publication of negative corporate information in the US and reduction in the likelihood of the Fed rate hike.
- The Parabolic indicator gives a bearish signal.
- The Bollinger bands have widened, which indicates high volatility. The upper band is titled down.
- The RSI indicator is below 50. It has formed a negative divergence.
- The MACD indicator gives a bearish signal.
The bearish momentum may develop in case Finance_Stocks falls below the last fractal low at 137. This level may serve as an entry point. The initial stop loss may be placed above the last fractal high and the Parabolic signal at 144. After opening the pending order, we shall move the stop to the next fractal low following the Bollinger and Parabolic signals. Thus, we are changing the potential profit/loss to the breakeven point. More risk-averse traders may switch to the 4-hour chart after the trade and place there a stop loss moving it in the direction of the trade. If the price meets the stop level (137) without reaching the order (144), we recommend to close the position: the market sustains internal changes that were not taken into account.
Summary of technical analysis
| Position | Sell |
| Sell stop | Below 137 |
| Stop loss | Above 144 |
- Získejte Certifikát

Poznámka:
Tento přehled má informativně poznávací charakter a publikuje se zdarma. Všechny údaje, uvedené v přehledu, jsou získány z otevřených zdrojů, jsou uznávány více méně spolehlivé. Přitom, neexistují žádné garance, že uvedená informace je úplná a přesná. Přehledy se v budoucnu neobnovují. Veškerá informace v každém přehledu, včetně názorů, ukazatelů, grafů, je pouze poskytována a není finančním poradenstvím nebo doporučením. Celý text nebo jeho jakákoliv část a také grafy nelze považovat za nabídku provádět nějaké transakce s jakýmikoliv aktivy. Společnost IFC Markets a její zaměstnanci za žádných okolností nemají žádnou odpovědnost za jakékoli kroky učiněné kýmkoliv po nebo v průběhu seznámení s přehledem.
