- Analýza
- Technická analýza
GBP/USD Technická analýza - GBP/USD Obchodování: 2019-07-04
Slowing services sector in UK bearish for GBPUSD
UK’s service sector expansion slowed in June. Will the GBPUSD continue declining?
Economic data from UK were negative after the unrevised final reading of Q1 GDP confirmed economic growth was at the strongest pace since the third quarter of 2017. Purchasing managers index data released on Tuesday showed that UK construction activity suffered its sharpest downturn in over a decade in June. And a speech by Bank of England Chairman Mark Carney late Tuesday suggested that the bank might loosen the tightening bias of its monetary policy. At the same time Markit’s Service PMI index declined to 50.2 from 51 in May, showing a slowing of expansion in services sector. Readings above 50.0 indicate expansion. Weaker UK data are bearish for GBPUSD.
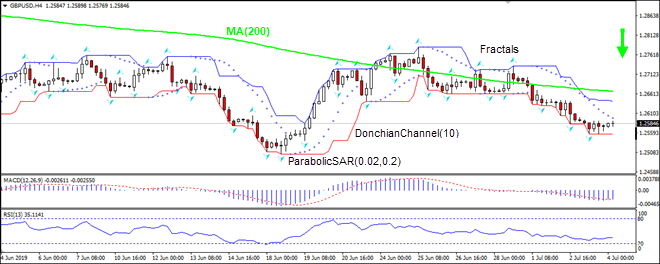
On the 4-hour timeframe the GBPUSD: H4 is retracing after hitting two-week low in mid-June.
- The Parabolic indicator gives a sell signal.
- The Donchian channel indicates downtrend: it is narrowing down.
- The MACD indicator gives a bullish signal: it is below the signal line and the gap is narrowing.
- The RSI oscillator is below the 50 level and has not breached into oversold zone yet.
We believe the bearish momentum will continue after the price breaches below lower boundary of Donchian channel at 1.2556. This level can be used as an entry point for placing a pending order to sell. The stop loss can be placed above the upper Donchian boundary at 1.2640. After placing the order, the stop loss is to be moved every day to the next fractal high, following Parabolic signals. Thus, we are changing the expected profit/loss ratio to the breakeven point. If the price meets the stop loss level (1.2640) without reaching the order (1.2556), we recommend cancelling the order: the market has undergone internal changes which were not taken into account.
Technical Analysis Summary
| Order | Sell |
| Sell stop | Below 1.2556 |
| Stop loss | Above 1.2640 |
- Získejte Certifikát

Poznámka:
Tento přehled má informativně poznávací charakter a publikuje se zdarma. Všechny údaje, uvedené v přehledu, jsou získány z otevřených zdrojů, jsou uznávány více méně spolehlivé. Přitom, neexistují žádné garance, že uvedená informace je úplná a přesná. Přehledy se v budoucnu neobnovují. Veškerá informace v každém přehledu, včetně názorů, ukazatelů, grafů, je pouze poskytována a není finančním poradenstvím nebo doporučením. Celý text nebo jeho jakákoliv část a také grafy nelze považovat za nabídku provádět nějaké transakce s jakýmikoliv aktivy. Společnost IFC Markets a její zaměstnanci za žádných okolností nemají žádnou odpovědnost za jakékoli kroky učiněné kýmkoliv po nebo v průběhu seznámení s přehledem.
