- Analýza
- Technická analýza
Akciový index Japonska Technická analýza - Akciový index Japonska Obchodování: 2018-12-20
Widening trade deficit bearish for NIKKEI
Japanese exports slowed in November. Will the NIKKEI continue declining?
Japanese economic data were weak on balance after disappointing Q3 GDP a month ago. The balance of trade turned negative in October, consumer confidence slipped in November, and the latest report by the Ministry of Finance indicated the trade balance deficit widened. The trade deficit rose to 737 billion yen from 450 billion a month ago. This is the fourth deficit in last five months. Japan’s exports slowed sharply due to weakening demand from China: exports rose 0.1% from the same month a year earlier, compared to 8.2% rise in October. Falling trade balance is bearish for NIKKEI.
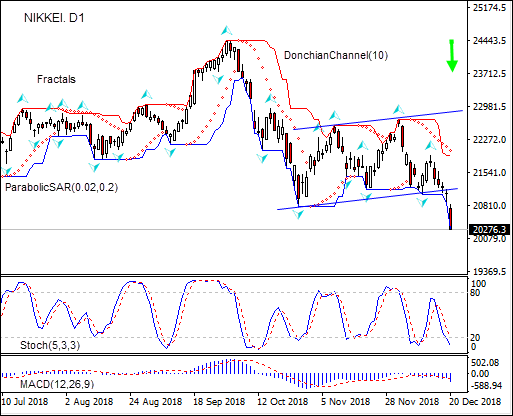
On the daily timeframe the NIKKEI: D1 has breached below the lower boundary of the descending channel.
- The Parabolic indicator gives a sell signal.
- The Donchian channel indicates downtrend: it is widening down.
- The MACD indicator gives a bearish signal: it is below the signal line and the gap is widening.
- The Stochastic oscillator has breached into the oversold zone, this is bullish.
We believe the bearish momentum will continue after the price breaches below the lower boundary of Donchian channel at 20274.50. This level can be used as an entry point for placing a pending order to sell. The stop loss can be placed above the upper Donchian channel at 21902.60. After placing the order, the stop loss is to be moved every day to the next fractal high, following Parabolic signals. Thus, we are changing the expected profit/loss ratio to the breakeven point. If the price meets the stop loss level (21902.60) without reaching the order (20274.50), we recommend cancelling the order: the market has undergone internal changes which were not taken into account.
Technical Analysis Summary
| Position | Sell |
| Sell stop | Below 20274.50 |
| Stop loss | Above 21902.60 |
- Získejte Certifikát

Poznámka:
Tento přehled má informativně poznávací charakter a publikuje se zdarma. Všechny údaje, uvedené v přehledu, jsou získány z otevřených zdrojů, jsou uznávány více méně spolehlivé. Přitom, neexistují žádné garance, že uvedená informace je úplná a přesná. Přehledy se v budoucnu neobnovují. Veškerá informace v každém přehledu, včetně názorů, ukazatelů, grafů, je pouze poskytována a není finančním poradenstvím nebo doporučením. Celý text nebo jeho jakákoliv část a také grafy nelze považovat za nabídku provádět nějaké transakce s jakýmikoliv aktivy. Společnost IFC Markets a její zaměstnanci za žádných okolností nemají žádnou odpovědnost za jakékoli kroky učiněné kýmkoliv po nebo v průběhu seznámení s přehledem.
