- Analýza
- Technická analýza
USD/NOK Technická analýza - USD/NOK Obchodování: 2018-12-11
Preparing for the meeting of the Central Bank of Norway
The next meeting of Norges Bank will be held on December 13. Is there a possibility for the Norwegian krone to strengthen?
On the USDNOK chart, it looks like a downward movement. Now, the Norges Bank’s rate is + 0.75%. Inflation in Norway in November 2018 increased to 3.5%, which is a 2-year high. Thus, consumer price growth has significantly exceeded the target level of the Norwegian Central Bank, which is 2.5%. In June 2018, the regulator has already raised the rate. Now, it is difficult to say whether he will do that once again this year. Various statements by Norges Bank’s representatives my affect the exchange rate of the krone. In addition to the possible rate hikes, an additional positive factor for the krone is the forecast of Statistics Norway (SSB). It increased the growth of non-oil GDP for the next year to 2.7% from 2.4% and expects inflation to accelerate. According to the SSB, the Norwegian Central Bank will increase its rate 5 times until the end of 2021. The business community Confederation of Norwegian Enterprise (NHO) has also raised its forecast for the growth of the Norwegian economy in 2019-2021. The GDP data for October, which may also affect the USDNOK dynamics, will be published on December 11 in Norway. Let us note that this currency may be sensitive to oil price changes, as Norway is an oil-producing country.
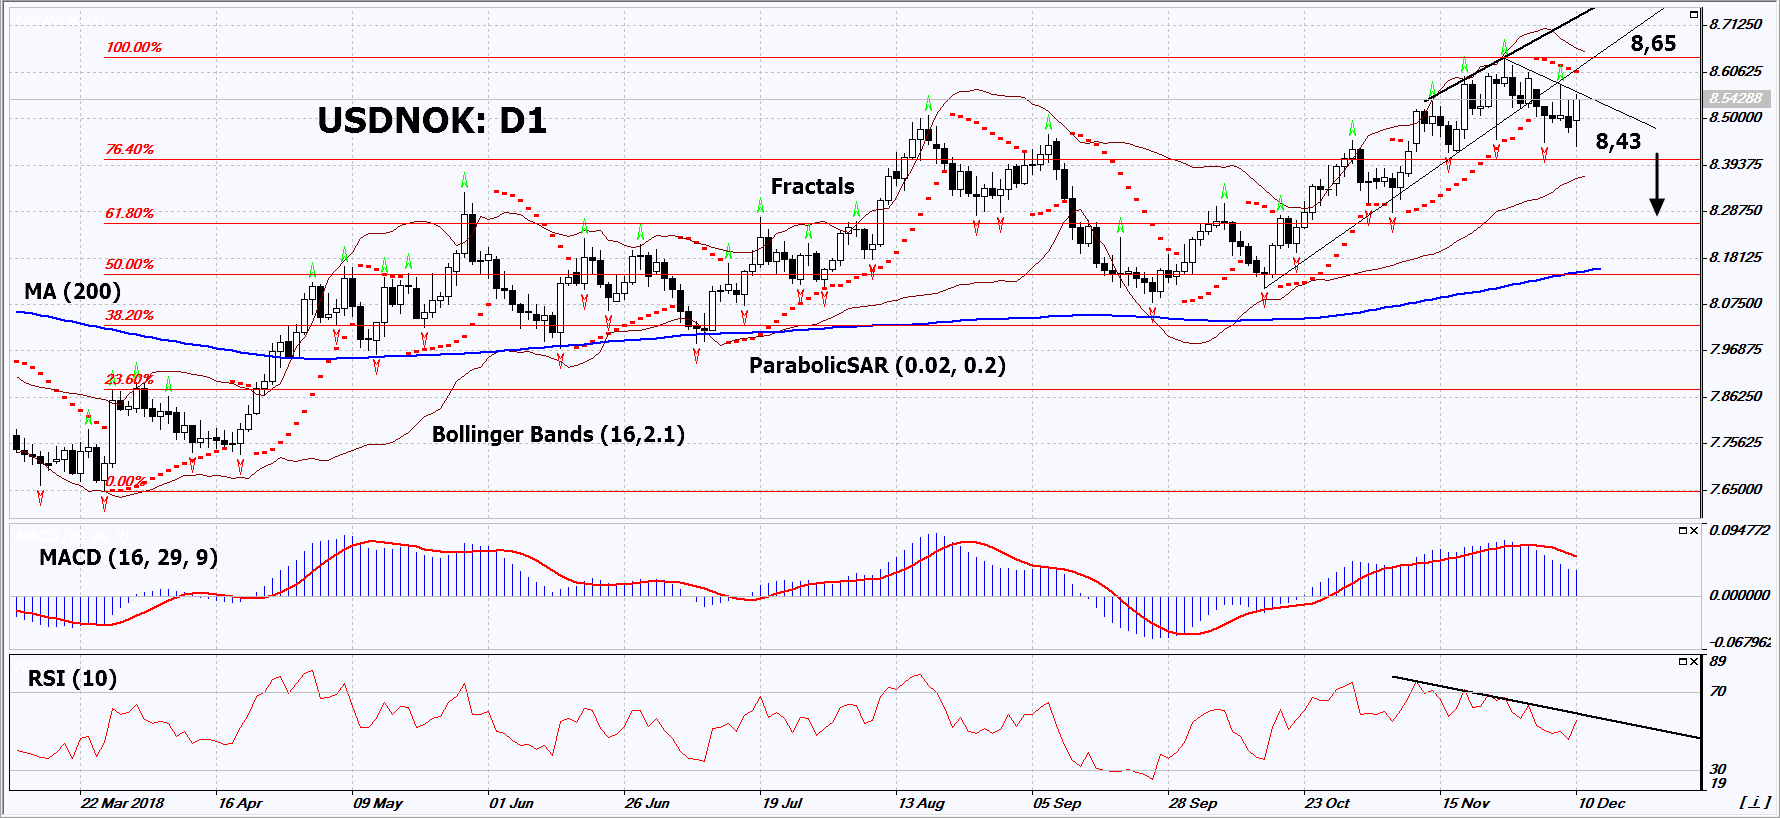
On the daily timeframe, USDNOK: D1 approached the support line of the uptrend. It must be breached down before opening a sell position. The further price increase is possible in case of the publication of positive macroeconomic data in Switzerland.
- The Parabolic indicator gives a bearish signal.
- The Bollinger bands are narrowing, which indicates low volatility. The upper band is titled downward.
- The RSI indicator is above 50. It has formed a negative divergence.
- The MACD indicator gives a bearish signal.
The bearish momentum may develop in case USDNOK falls below its last low at 8.43. This level may serve as an entry point. The initial stop loss may be placed above the last fractal high, the high since May 2017, the upper Bollinger band and the Parabolic signal at 865. After opening the pending order, we shall move the stop to the next fractal high following the Bollinger and Parabolic signals. Thus, we are changing the potential profit/loss to the breakeven point. More risk-averse traders may switch to the 4-hour chart after the trade and place there a stop loss moving it in the direction of the trade. If the price meets the stop level (8.65) without reaching the order (8.43), we recommend to close the position: the market sustains internal changes that were not taken into account.
Summary of technical analysis
| Position | Sell |
| Sell stop | Below 8.43 |
| Stop loss | Above 8.65 |
- Získejte Certifikát

Poznámka:
Tento přehled má informativně poznávací charakter a publikuje se zdarma. Všechny údaje, uvedené v přehledu, jsou získány z otevřených zdrojů, jsou uznávány více méně spolehlivé. Přitom, neexistují žádné garance, že uvedená informace je úplná a přesná. Přehledy se v budoucnu neobnovují. Veškerá informace v každém přehledu, včetně názorů, ukazatelů, grafů, je pouze poskytována a není finančním poradenstvím nebo doporučením. Celý text nebo jeho jakákoliv část a také grafy nelze považovat za nabídku provádět nějaké transakce s jakýmikoliv aktivy. Společnost IFC Markets a její zaměstnanci za žádných okolností nemají žádnou odpovědnost za jakékoli kroky učiněné kýmkoliv po nebo v průběhu seznámení s přehledem.
