- Analýza
- Technická analýza
Palladium Technická analýza - Palladium Obchodování: 2019-10-18
Rising car sales bullish for XPDUSD
EU car sales grew strongly in September. Will the XPDUSD continue gaining?
Palladium is one of three precious metals together with platinum and rhodium used in catalytic converters for car exhausts. And more than 80 percent of the world's palladium is used in the catalytic converters that help vehicles reduce their pollutant output. Sales of new passenger cars in the European Union rose sharply in September compared to a year earlier - the car industry association in European Union, ACEA, reported on Wednesday care sales increased by 14.5% to nearly 1.25 million cars in EU. Double-digit growth was recorded in four of the five major car markets. Increasing demand for catalytic converters is bullish for XPDUSD.
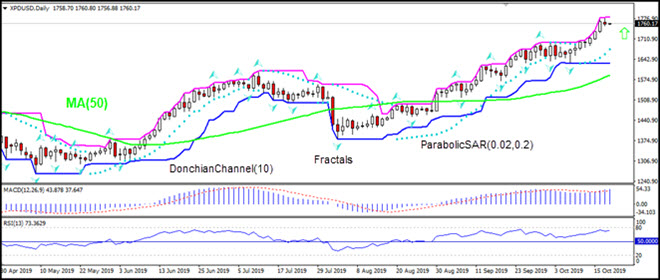
On the daily timeframe the XPDUSD: D1 is rising above the 50-day moving average MA(50).
- The Parabolic indicator gives a buy signal.
- The Donchian channel indicates uptrend: it is widening up.
- The MACD indicator gives a bullish signal: it is above the signal line and the gap is widening.
- The RSI oscillator is near the overbought zone but has not crossed into it.
We believe the bullish momentum will continue after the price breaches above the upper boundary of Donchian channel at 1781.87. This level can be used as an entry point for placing a pending order to buy. The stop loss can be placed below the lower Donchian boundary at 103.86. After placing the order, the stop loss is to be moved every day to the next fractal low, following Parabolic signals. Thus, we are changing the expected profit/loss ratio to the breakeven point. If the price meets the stop loss level (1628.79) without reaching the order (1781.87), we recommend cancelling the order: the market has undergone internal changes which were not taken into account.
Technical Analysis Summary
| Order | Buy |
| Buy stop | Above 1781.87 |
| Stop loss | Below 1628.79 |
- Získejte Certifikát

Poznámka:
Tento přehled má informativně poznávací charakter a publikuje se zdarma. Všechny údaje, uvedené v přehledu, jsou získány z otevřených zdrojů, jsou uznávány více méně spolehlivé. Přitom, neexistují žádné garance, že uvedená informace je úplná a přesná. Přehledy se v budoucnu neobnovují. Veškerá informace v každém přehledu, včetně názorů, ukazatelů, grafů, je pouze poskytována a není finančním poradenstvím nebo doporučením. Celý text nebo jeho jakákoliv část a také grafy nelze považovat za nabídku provádět nějaké transakce s jakýmikoliv aktivy. Společnost IFC Markets a její zaměstnanci za žádných okolností nemají žádnou odpovědnost za jakékoli kroky učiněné kýmkoliv po nebo v průběhu seznámení s přehledem.
