- Analytik
- Technische Analyse
AUD/USD Technische Analyse - AUD/USD Handel: 2019-06-25
Getting ready for the next meeting of the Reserve Bank of Australia
The head of the Reserve Bank of Australia (RBA) Philip Lowe expressed doubts about the effectiveness of the monetary policy of world central banks to reduce interest rates. Will the Australian dollar quotations increase?
Such a movement means its strengthening against the US dollar. Currently, the RBA rate is at historic lows at 1.25%. Investors are waiting for the inevitable rate cut to 1% already at the next meeting of the Australian Central Bank on July 2, 2019 and the subsequent reduction to 0.75% by the end of this year. After the statement of the RBA head , the probability of falling rates to 0.75% decreased. Market participants believe that a level of 1% may be sufficient for the Australian dollar. This provided support for AUDUSD. An additional positive factor for it is investors' expectations that the US Federal Reserve will lower its rate at the next meeting on July 31, 2019. Currently the probability of such event is estimated at 62%. Fed rate cut forecasts have a negative effect on the US dollar.
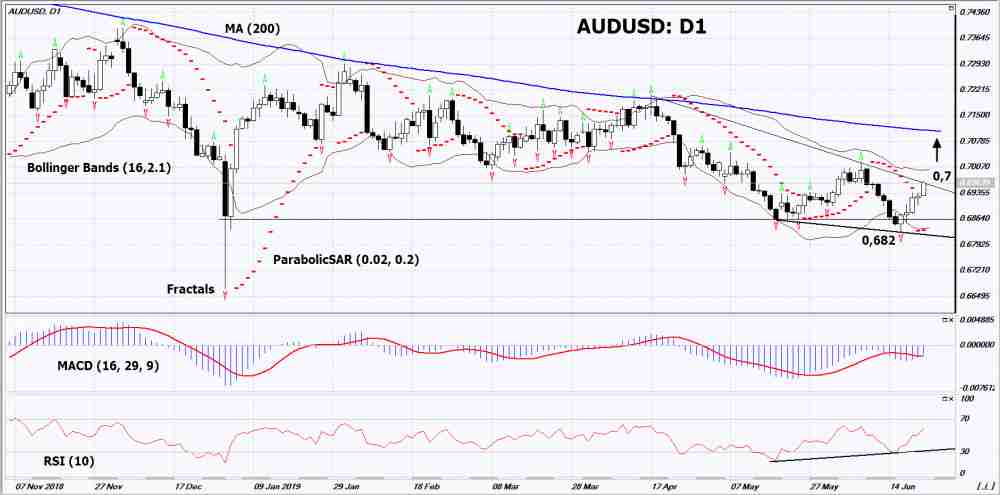
On the daily timeframe AUDUSD: D1 demonstrated a false breakdown of the support level and began a correction to the top. Various technical analysis indicators have generated uptrend signals. Further growth of quotations is possible in case of statements by Reserve Bank of Australia at a meeting on July 2 that it will refrain from excessive easing of monetary policy.
- The Parabolic indicator demonstrated uptrend signal.
- The Bolinger Bands narrowed, indicating low volatility. Both lines of Bollinger have a slope up.
- The RSI indicator is above the 50 mark. It has formed a divergence to increase.
- The MACD indicator shows a signal to increase.
The bullish momentum may develop in case if AUDUSD exceeds the upper Bollinger line and the downtrend resistance line: 0.7. This level may serve as an entry point. The initial stop loss may be placed below the last lower fractal, the bottom Bollinger line at 0,682. After opening the pending order, we shall move the stop to the next fractal low following the Bollinger and Parabolic signals. Thus, we are changing the potential profit/loss to the breakeven point. More risk-averse traders may switch to the 4-hour chart after the trade and place a stop loss moving it in the direction of the trade. If the price meets the stop level (0,682) without reaching the order (0,7), we recommend to cancel the order: the market sustains internal changes that were not taken into account.
Technical Analysis Summary
| Position | Buy |
| Buy stop | Above 0,7 |
| Stop loss | Below 0,682 |
- Zertifikat erhalten

Hinweis:
Diese Übersicht hat einen informativen und Tutorencharakter und wird kostenlos veröffentlicht. Alle Daten, die in dieser Übersicht eingeschlossen sind, sind von mehr oder weniger zuverlässigen öffentlichen Quellen erhalten. Außerdem gibt es keine Garantie, dass die angezeigte Information voll und genau ist. Die Übersichten werden nicht aktualisiert. Die ganze Information in jeder Übersicht, einschließlich Meinungen, Hinweise, Charts und alles andere, werden nur für Vertrautmachen veröffentlicht und sind keine Finanzberatung oder Empfehlung. Der ganze Text und sein jeder Teil sowie die Charts können nicht als ein Geschäftsangebot betrachtet werden. Unter keinen Umständen sind IFC Markets und seine Angestellten für die Handlungen, die von jemand anderem während oder nach dem Lesen der Übersicht genommen werden, verantwortlich.
