- Analytik
- Technische Analyse
Deutscher Aktienindex Technische Analyse - Deutscher Aktienindex Handel: 2019-11-08
Improving German data bullish for DE30
Germany’s private sector activity contraction was less than forecast in October. Will the DE30 stock index continue advancing?
German data lately were positive on balance: the services sector expansion accelerated in October and contraction in manufacturing sector slowed. Markit’s services PMI rose to 51.6 from 51.4 while the manufacturing PMI inched up to 42.1 from 41.7 in September. Readings above 50 indicate expansion, below 50 mark contraction. Composite PMI edged up to 48.9 from 48.5 in September, indicating slowing contraction in private sector activity for October. And factory orders rose 1.3% on month in September after 0.4% decline in August. At the same time construction PMI rose to 51.5 from 50.1 in September. And on the consumer end retail sales rose 3.4% over year in September after 3.1% growth in August. Improving data are bullish for Germany’s stock market index.
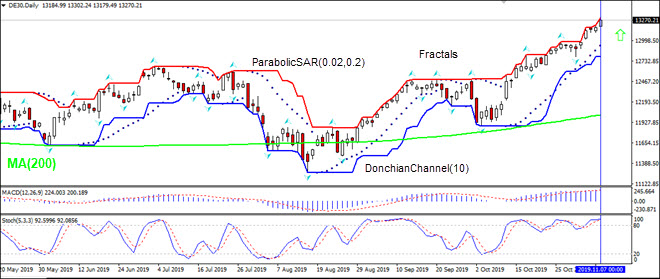
On the daily timeframe DE30: D1 is rising above 200-day moving average MA(200) which is also rising.
- The Donchian channel indicates uptrend: it is widening up.
- The Parabolic indicator has formed a buy signal.
- The MACD indicator is above the signal line and the gap is widening, which is a bullish signal.
- The Stochastic oscillator is in the overbought zone, this is bearish.
We believe the bullish momentum will continue as the price breaches above the upper boundary of Donchian channel at 13206.55. This level can be used as an entry point for placing a pending order to buy. The stop loss can be placed below the lower Donchian boundary at 12742.60. After placing the order, the stop loss is to be moved every day to the next fractal low, following Parabolic signals. Thus, we are changing the expected profit/loss ratio to the breakeven point. If the price meets the stop loss level (12792.60) without reaching the order (13206.55), we recommend cancelling the order: the market has undergone internal changes which were not taken into account.
Technical Analysis Summary
| Position | Buy |
| Buy stop | Above 13206.55 |
| Stop loss | Below 12792.60 |
- Zertifikat erhalten

Hinweis:
Diese Übersicht hat einen informativen und Tutorencharakter und wird kostenlos veröffentlicht. Alle Daten, die in dieser Übersicht eingeschlossen sind, sind von mehr oder weniger zuverlässigen öffentlichen Quellen erhalten. Außerdem gibt es keine Garantie, dass die angezeigte Information voll und genau ist. Die Übersichten werden nicht aktualisiert. Die ganze Information in jeder Übersicht, einschließlich Meinungen, Hinweise, Charts und alles andere, werden nur für Vertrautmachen veröffentlicht und sind keine Finanzberatung oder Empfehlung. Der ganze Text und sein jeder Teil sowie die Charts können nicht als ein Geschäftsangebot betrachtet werden. Unter keinen Umständen sind IFC Markets und seine Angestellten für die Handlungen, die von jemand anderem während oder nach dem Lesen der Übersicht genommen werden, verantwortlich.
