- Analytik
- Technische Analyse
Japanischer Aktienindex Technische Analyse - Japanischer Aktienindex Handel: 2018-12-20
Widening trade deficit bearish for NIKKEI
Japanese exports slowed in November. Will the NIKKEI continue declining?
Japanese economic data were weak on balance after disappointing Q3 GDP a month ago. The balance of trade turned negative in October, consumer confidence slipped in November, and the latest report by the Ministry of Finance indicated the trade balance deficit widened. The trade deficit rose to 737 billion yen from 450 billion a month ago. This is the fourth deficit in last five months. Japan’s exports slowed sharply due to weakening demand from China: exports rose 0.1% from the same month a year earlier, compared to 8.2% rise in October. Falling trade balance is bearish for NIKKEI.
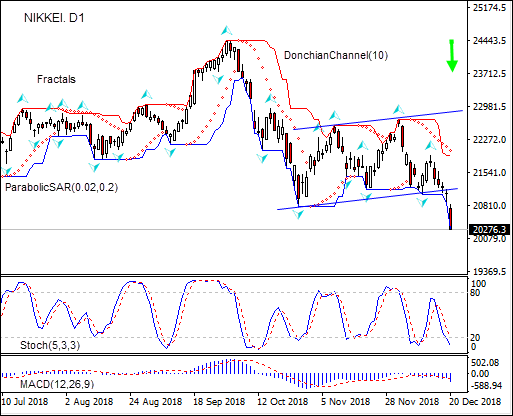
On the daily timeframe the NIKKEI: D1 has breached below the lower boundary of the descending channel.
- The Parabolic indicator gives a sell signal.
- The Donchian channel indicates downtrend: it is widening down.
- The MACD indicator gives a bearish signal: it is below the signal line and the gap is widening.
- The Stochastic oscillator has breached into the oversold zone, this is bullish.
We believe the bearish momentum will continue after the price breaches below the lower boundary of Donchian channel at 20274.50. This level can be used as an entry point for placing a pending order to sell. The stop loss can be placed above the upper Donchian channel at 21902.60. After placing the order, the stop loss is to be moved every day to the next fractal high, following Parabolic signals. Thus, we are changing the expected profit/loss ratio to the breakeven point. If the price meets the stop loss level (21902.60) without reaching the order (20274.50), we recommend cancelling the order: the market has undergone internal changes which were not taken into account.
Technical Analysis Summary
| Position | Sell |
| Sell stop | Below 20274.50 |
| Stop loss | Above 21902.60 |
- Zertifikat erhalten

Hinweis:
Diese Übersicht hat einen informativen und Tutorencharakter und wird kostenlos veröffentlicht. Alle Daten, die in dieser Übersicht eingeschlossen sind, sind von mehr oder weniger zuverlässigen öffentlichen Quellen erhalten. Außerdem gibt es keine Garantie, dass die angezeigte Information voll und genau ist. Die Übersichten werden nicht aktualisiert. Die ganze Information in jeder Übersicht, einschließlich Meinungen, Hinweise, Charts und alles andere, werden nur für Vertrautmachen veröffentlicht und sind keine Finanzberatung oder Empfehlung. Der ganze Text und sein jeder Teil sowie die Charts können nicht als ein Geschäftsangebot betrachtet werden. Unter keinen Umständen sind IFC Markets und seine Angestellten für die Handlungen, die von jemand anderem während oder nach dem Lesen der Übersicht genommen werden, verantwortlich.
