- Analytik
- Technische Analyse
USD/PLN Technische Analyse - USD/PLN Handel: 2019-10-08
European Court ruling could help zloty rate
The representative of the National Bank of Poland Lukasz Hardt said that the decision of the European Court of Mortgage Loans does not pose a risk to the Polish banking sector. Will the polish zloty continue growing?
On the chart, it looks like a downtrend movement. Earlier, the European Court ruled that Polish mortgage borrowers have the right to convert their loans into zlotys from Swiss francs. The number of foreign currency mortgages in the country exceeds 700 thousand people, so the demand for zloty has increased. A positive factor was also the confirmation of the statistical service of Poland last year's GDP growth of 5.1%. Recall that in early October, the National Bank of Poland kept the rate at 1.5%. This is significantly higher than the rates of central banks in Western Europe. Inflation in Poland fell in September to 2.6% on an annualized basis from 2.9% in August. The National Bank said it expects its further reduction to 2.3% by the end of 2019. At the same time, GDP growth this year should be 4.3%.
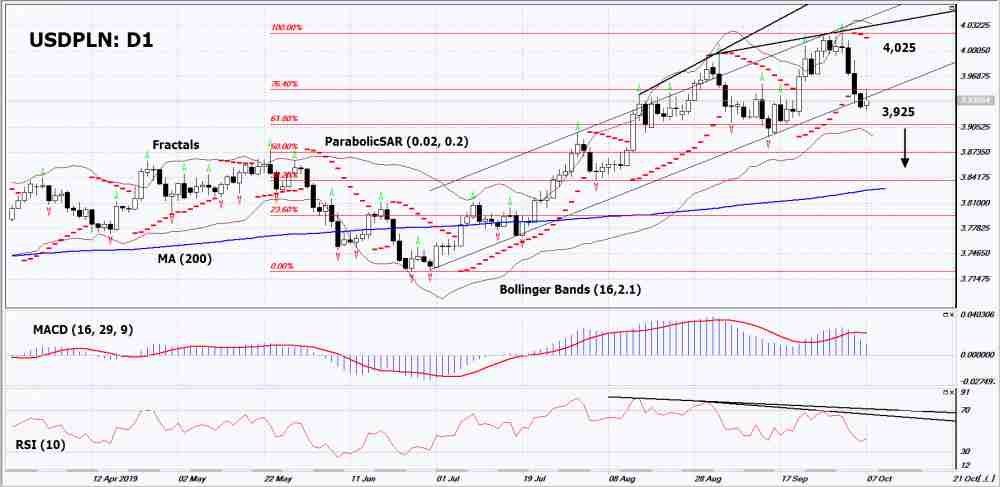
On the daily timeframe USDPLN: D1 approached the support line of the uptrend. Before opening a sell position, it must be broken down. Various technical analysis indicators formed a downward signal. Decrease in quotations is possible in case of publication of positive data on the Polish economy and a weakening US dollar.
- The Parabolic indicator gives a downtrend signal.
- The Bolinger bandswidened, indicating high volatility. Both Bollinger Lines Slope Down.
- The RSI indicator It is below the 50 mark. It has formed a double divergence to fall.
- The MACD indicator gives a bearish signal.
The bearish momentum may develop if USDPLN drops below its last low: 3.925. This level can be used as an entry point. The initial stop- lose may be placed higher than the last upper fractal, the highest since March 2017 and the Parabolic signal: 4.025. After opening the pending order, the stop shall be moved following Bollinger and Parabolic signals to the next fractal minimum. TThus, we are changing the potential profit/loss to the breakeven point. More risk-averse traders may switch to the 4-hour chart after the trade and place a stop loss moving it in the direction of the trade. If the price meets the stop level (4,025) without reaching the order (3,925), we recommend to cancel the order: the market sustains internal changes that were not taken into account.
Technical Analysis Summary
| Position | Sell |
| Sell stop | Below 3,925 |
| Stop loss | Above 4,025 |
- Zertifikat erhalten

Hinweis:
Diese Übersicht hat einen informativen und Tutorencharakter und wird kostenlos veröffentlicht. Alle Daten, die in dieser Übersicht eingeschlossen sind, sind von mehr oder weniger zuverlässigen öffentlichen Quellen erhalten. Außerdem gibt es keine Garantie, dass die angezeigte Information voll und genau ist. Die Übersichten werden nicht aktualisiert. Die ganze Information in jeder Übersicht, einschließlich Meinungen, Hinweise, Charts und alles andere, werden nur für Vertrautmachen veröffentlicht und sind keine Finanzberatung oder Empfehlung. Der ganze Text und sein jeder Teil sowie die Charts können nicht als ein Geschäftsangebot betrachtet werden. Unter keinen Umständen sind IFC Markets und seine Angestellten für die Handlungen, die von jemand anderem während oder nach dem Lesen der Übersicht genommen werden, verantwortlich.
