Dow Jones Slump: Fall or Reversal?
January Job Report Triggered US Market Slump
The Dow Jones industrial average tumbled 4.6% on Monday , entering correction territory with a 10% decline from the January 26 record high.
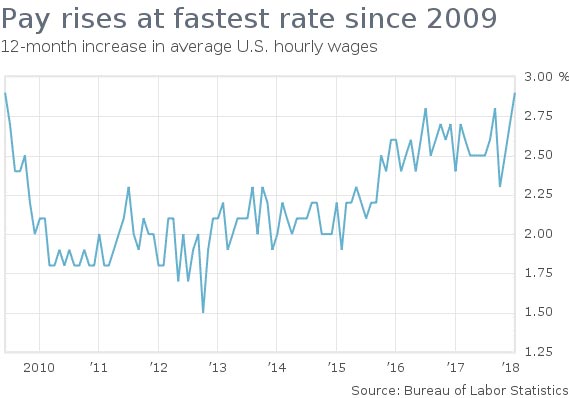
The stock market retreat was triggered by a better than expected January jobs report on Friday. The Bureau of Labor Statistics reported 200 thousand increase in nonfarm payrolls in January following the 148 thousand gain in December. The increase in jobs was higher than expected, but more importantly it was accompanied by 2.9% increase in average hourly earnings year-over-year in January from 2.7% in December.
Wages Increase is the Fundamental Reason for Market Sell-off
The increase in wages is a considered an indicator of tightening in labor market, which should cause inflation that monetary authorities are mandated to contain. The strong labor market report was seen as providing support to views the Federal Reserve may not just stick to previously indicated plan of three rate hikes in 2018 but actually implement four rate hikes.
Inflation and Rising Treasury Yields Point to Faster Fed Tightening
Recent rise in Treasury yields indicates that market participants expect the Federal Reserve will continue monetary policy tightening, and the yield on 10-year Treasury note hit 2.883% Monday. The uptick in personal consumption expenditures index, Federal Reserve’s preferred gauge of inflation, also provides support for the view tight labor market is contributing to the rise in inflation.
US Dollar Strengthening Also Indicates Faster Rate Hikes
The ICE US dollar index actually gained 0.3% on the Bureau of Economic Analysis report January 28 the core personal consumption expenditure index rose 0.2% on month in December from 0.1% the previous month. And the dollar index gained 0.6% last Friday on unexpectedly good jobs report. Continued strengthening of the dollar, after it recorded last week the first weekly gain since mid-December, is another indicator signaling market participants expect monetary authorities will fasten the pace of rate hikes.
No Wonder – Market Corrects as Liquidity is Expected to Fall
The loosening of monetary policy implemented through successive Quantitative Easing programs by the Federal Reserve has been the major contributor to the stock market recovery and rally since 2008 financial crisis. President Trump’s pledges of fiscal stimulus programs like tax cuts and infrastructure spending programs also contributed to the recent leg of the US stock market rally. And there is no wonder the stock market is reacting at last to shift to monetary tightening in the Federal Reserve monetary policy stance.
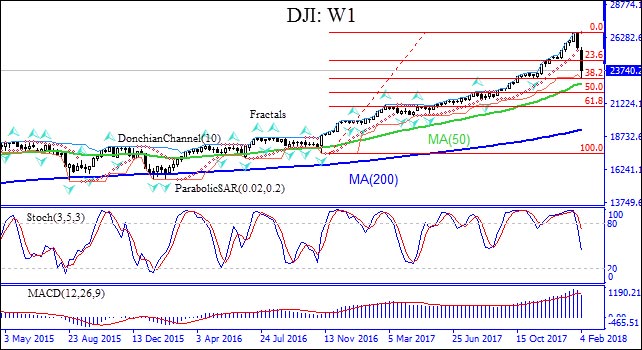
What to Expect from Dow Jones Index?
Let us have a look at the Dow price chart and see what can be said about expected Dow price movement.
The Dow has hit the Fibonacci retracement level 38.2 counted from the fractal low of the 2016 US presidential election.
- The Donchian channel indicates downtrend: it is tilted lower.
- Parabolic indicator has formed a sell signal.
- The MACD indicator is above the signal line and the gap is narrowing, which is a bearish signal.
- The stochastic oscillator is falling but has not reached the oversold zone.
The technical picture is bearish, and the DJI is expected to fall further breaching below the Fibonacci retracement level 38.2, confirmed also by the lower bound of the Donchian channel at 23127. Once that level is breached the Fibonacci retracement level 50 at 22095 is the next technical support level. In case DJI is unable to breach below the Fibonacci 38.2 a bullish reversal may develop.