- Analytics
- Technical Analysis
Australian Stock Index Technical Analysis - Australian Stock Index Trading: 2018-05-22
Stocks are undergoing correction amid cheaper raw materials
Stock prices of the Australian mining companies fell following the decline in iron ore prices in China. Will S&P/ASX 200 prices fall?
The share of commodity companies in the index is 18%. On Monday, iron ore prices on the Dalian Commodity Exchange fell by more than 3% to 462 yuan ($ 72.29) per ton. The reduction in demand for ferrous metallurgy products is explained by the beginning of the rainy season in southern China and, as a result, a decrease in activity in construction. It is difficult to say whether there are more convincing reasons for the decrease in steel and iron ore prices, but, perhaps, trade disagreements between China and the United States had a negative impact. An additional negative for the S&P/ASX 200 stock index may be the growth of unemployment rate in Australia in April, the decrease in retail sales for the first quarter of 2018, as well as the emerging strengthening of the Australian dollar.
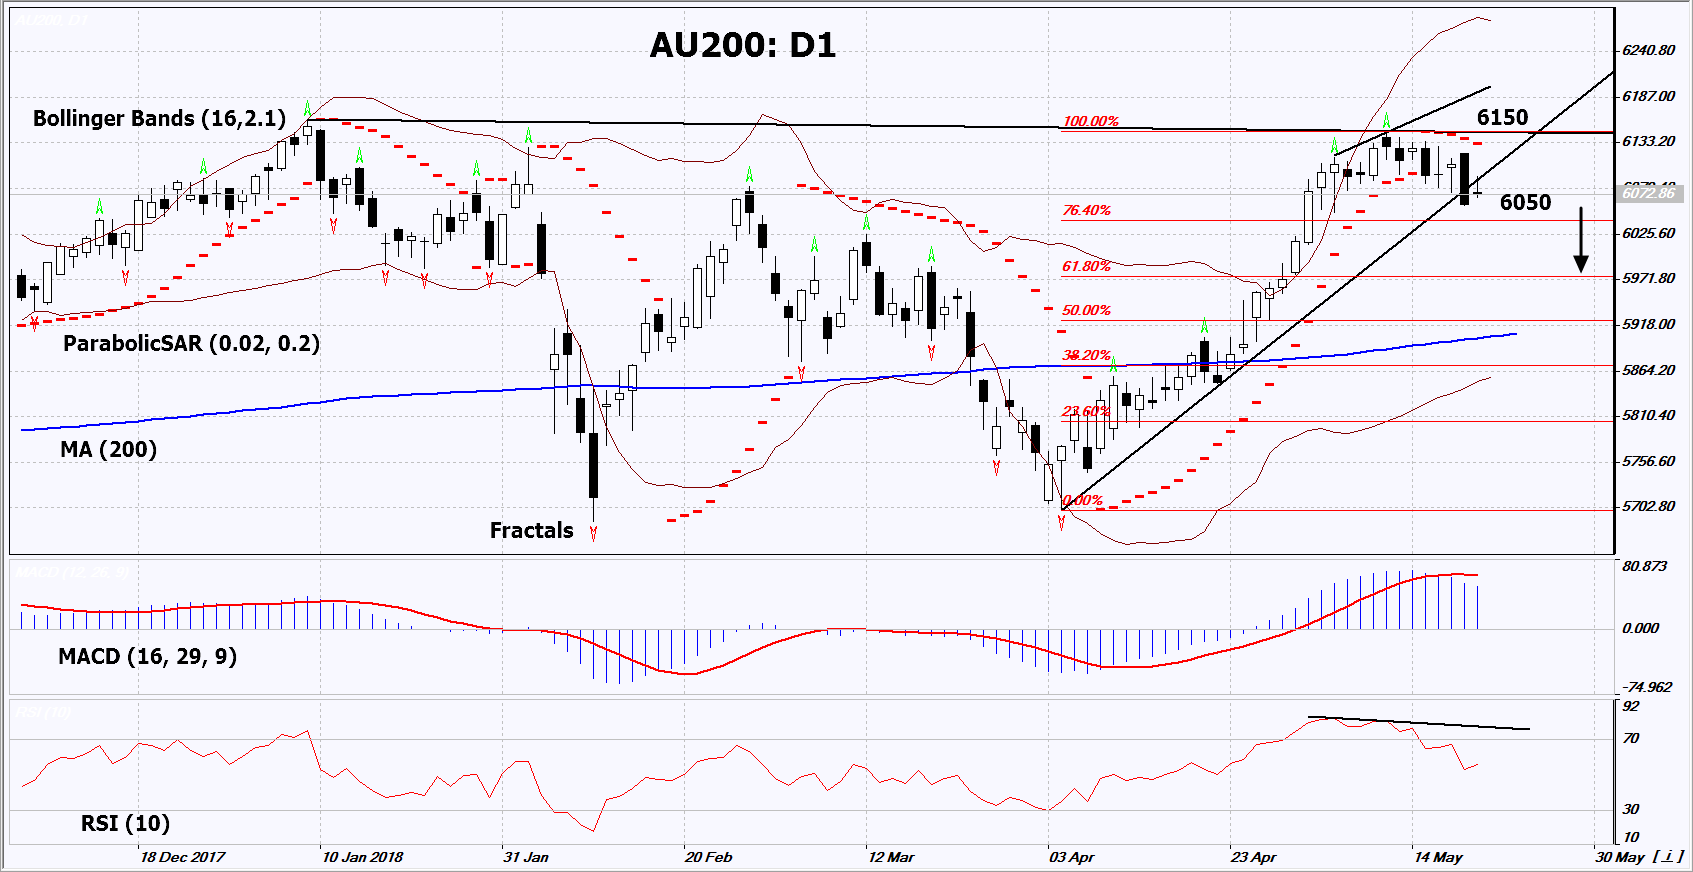
On the daily timeframe, AU200: D1 breached down the support line of the uptrend. Negative economic and corporate news may contribute to the reduction of prices.
- The Parabolic indicator gives a bearish signal.
- The Bollinger bands have widened, which indicates high volatility. The upper band is titled down.
- The RSI indicator is above 50. It has formed a negative divergence.
- The MACD indicator gives bearish signals.
The bearish momentum may develop in case AU200 falls below its last low at 6050. This level may serve as an entry point. The initial stop loss may be placed above the last fractal high, the 4-year high and the Parabolic signal at 6150. After opening the pending order, we shall move the stop to the next fractal high following the Bollinger and Parabolic signals. Thus, we are changing the potential profit/loss to the breakeven point. More risk-averse traders may switch to the 4-hour chart after the trade and place there a stop loss moving it in the direction of the trade. If the price meets the stop level at 6150 without reaching the order at 6050, we recommend to close the position: the market sustains internal changes that were not taken into account.
Summary of technical analysis
| Position | Sell |
| Sell stop | Below 6050 |
| Stop loss | Above 6150 |
- Get Certificate

Note:
This overview has an informative and tutorial character and is published for free. All the data, included in the overview, are received from public sources, recognized as more or less reliable. Moreover, there is no guarantee that the indicated information is full and precise. Overviews are not updated. The whole information in each overview, including opinion, indicators, charts and anything else, is provided only for familiarization purposes and is not financial advice or а recommendation. The whole text and its any part, as well as the charts cannot be considered as an offer to make a deal with any asset. IFC Markets and its employees under any circumstances are not liable for any action taken by someone else during or after reading the overview.
