- Analytics
- Technical Analysis
AUD Currency Index Technical Analysis - AUD Currency Index Trading: 2018-08-08
The Reserve Bank of Australia expects an economic growth
In this review, we suggest considering the personal composite instrument (PCI) &AUD_Index. It reflects the price change dynamics of the Australian dollar against other world currencies. Will AUD_Index prices rise?
The Reserve Bank of Australia (RBA) at its meeting on August 7, 2018, kept the discount rate at the level of 1.5%. It has been in this level for already 2 years, which is the longest period in the modern history of Australia. The RBA noted a number of positive trends in the Australian economy. It expects a GDP growth at the level of 3% in the current and next years, a preservation of low inflation within the target level of 2-3%, as well as low unemployment rate of about 5%. Market participants estimate chances of an RBA rate hike in 12 months as 50/50%. A good economic forecast can support the Australian dollar. An additional positive may be the increase in ferrous and non-ferrous metals prices. China plans to reduce their production with the aim of improving its ecology. This can support the Australian metallurgy and economy as a whole. Last week, very positive economic data on retail trade for the 2nd quarter and the foreign trade balance for June were published in Australia. This week, no significant statistics are expected, but on Wednesday, RBA Governor Philip Lowe will give a speech, which may affect the Australian dollar. In addition, data on the foreign trade of China, which is an important trading partner of Australia, will be published.
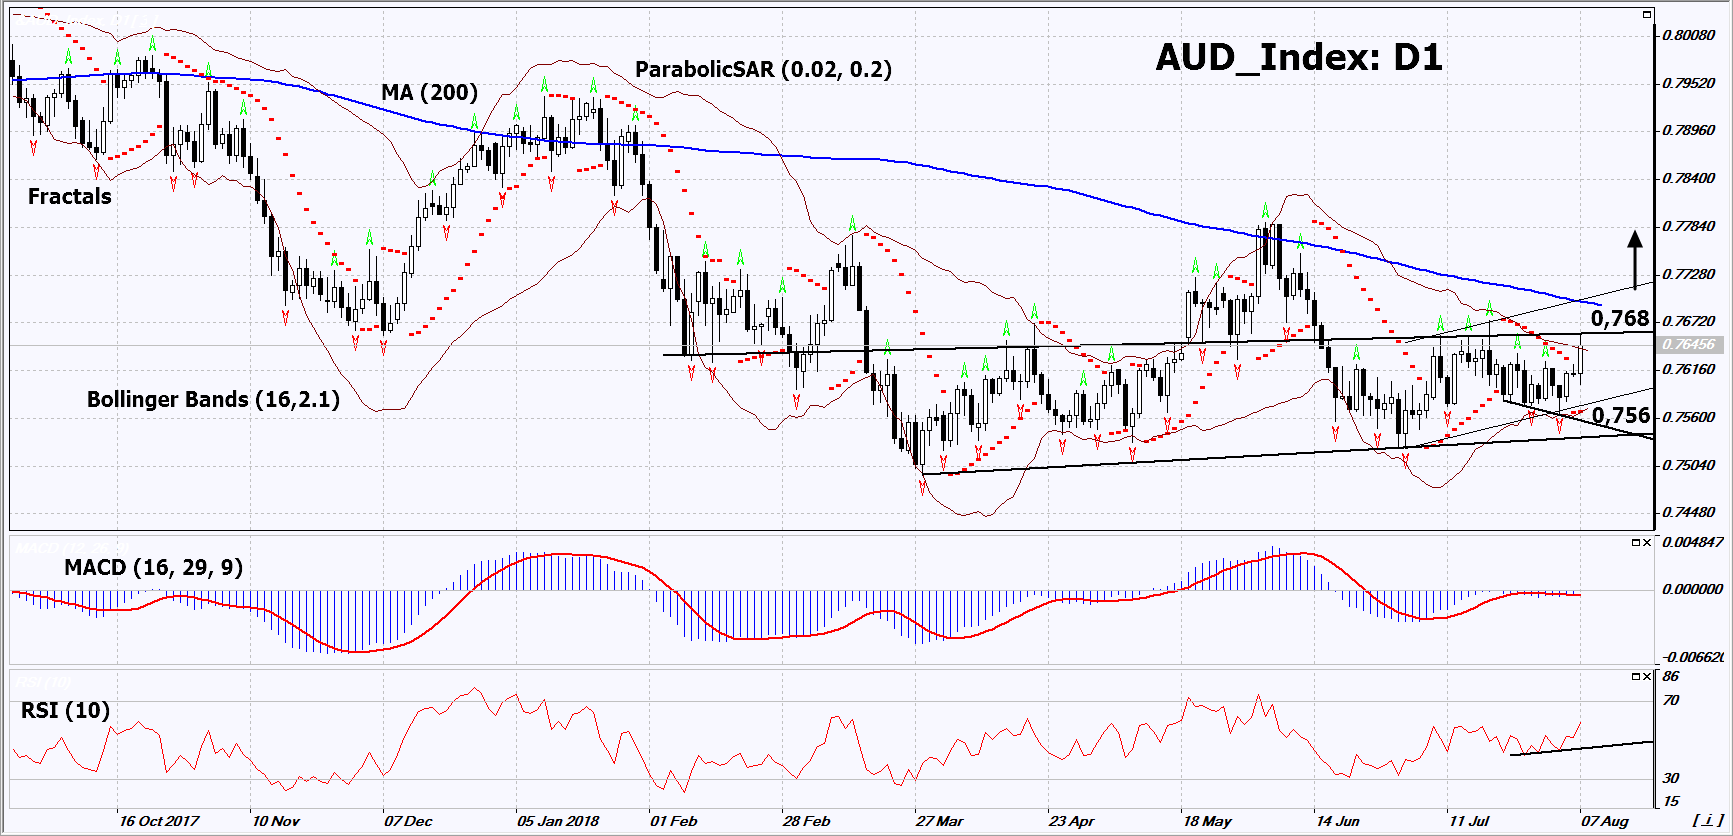
On the daily timeframe, AUD_Index: D1 approached the upper boundary of the neutral range. It must be breached up to form an uptrend. A number of technical analysis indicators formed buy signals. The further price increase is possible in case of positive economic data in China and Australia.
- The Parabolic indicator gives a bullish signal.
- The Bollinger bands have narrowed a lot, which indicates low volatility.
- The RSI indicator is above 50. It has formed a positive divergence.
- The MACD indicator gives a bullish signal.
The bullish momentum may develop in case AUD_Index exceeds the three last fractal highs and the upper Bollinger band at 0.768. This level may serve as an entry point. The initial stop loss may be placed below the last fractal low, the lower Bollinger band and the Parabolic signal at 0.756. After opening the pending order, we shall move the stop to the next fractal low following the Bollinger and Parabolic signals. Thus, we are changing the potential profit/loss to the breakeven point. More risk-averse traders may switch to the 4-hour chart after the trade and place there a stop loss moving it in the direction of the trade. If the price meets the stop level (0.756) without reaching the order (0.768), we recommend to close the position: the market sustains internal changes that were not taken into account.
Summary of technical analysis
| Position | Buy |
| Buy stop | Above 0.768 |
| Stop loss | Below 0.756 |
- Get Certificate

Note:
This overview has an informative and tutorial character and is published for free. All the data, included in the overview, are received from public sources, recognized as more or less reliable. Moreover, there is no guarantee that the indicated information is full and precise. Overviews are not updated. The whole information in each overview, including opinion, indicators, charts and anything else, is provided only for familiarization purposes and is not financial advice or а recommendation. The whole text and its any part, as well as the charts cannot be considered as an offer to make a deal with any asset. IFC Markets and its employees under any circumstances are not liable for any action taken by someone else during or after reading the overview.
