- Analytics
- Technical Analysis
Brent Crude Oil Technical Analysis - Brent Crude Oil Trading: 2016-11-21
OPEC plans oil production “freeze”
Non-official OPEC meeting took place on Friday in Qatar where oil output “freeze” was discussed once again. The official OPEC meeting will take place on November 30, 2016. Will Brent oil advance?
Russian Minister of energy Alexander Novak said OPEC members are close to decision on oil output “freeze”. Being one of the major non-OPEC oil producers, Russia is ready to limit output for 6 months or longer. Energy minister of Saudi Arabia Khalid-al-Falih said OPEC is to cut production to the lower boundary of preliminary approved range of 32.5-33mln bpd. OPEC oil production was 33.64mln bpd in October 2016. Critical deterrent to “freeze” was position of Iran which demanded its quote to be raised to 4-4.2mln barrels per day. Previously, OPEC members agreed on Iran quote to be just 3.6-3.7mln bpd. As negotiations are going on, Iran raised production in October to 3.92mln bpd. Reportedly, other OPEC members agreed on Iran quote at that level. Negotiations will run on.
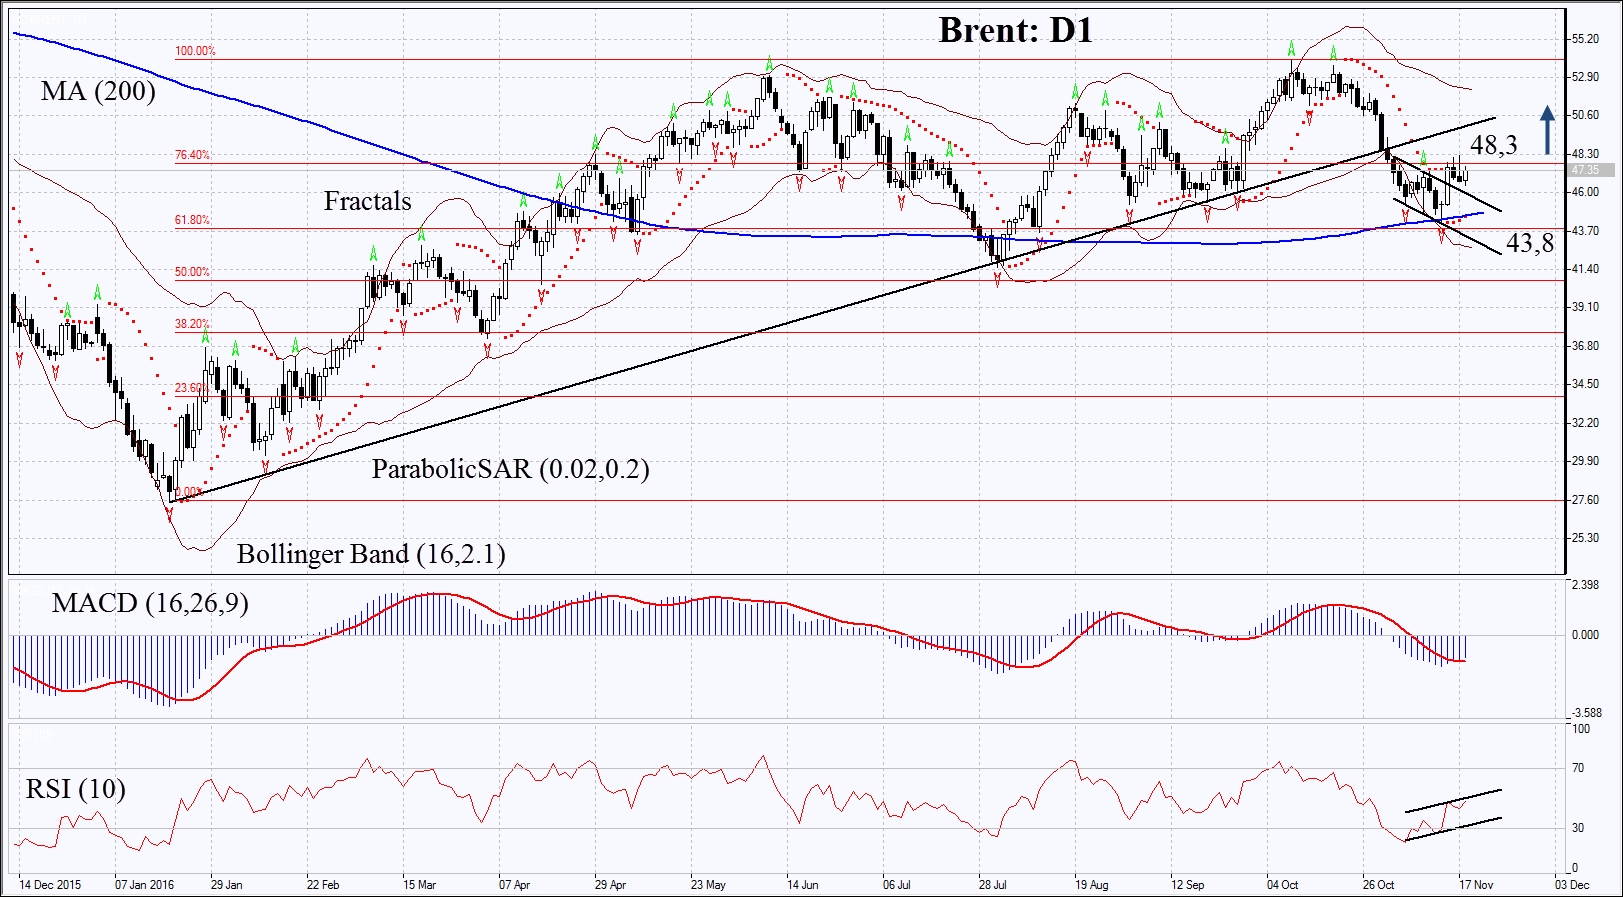
On the daily chart Brent: D1 has fallen towards the support of the sideways channel, the Fibonacci line and 200-day MA. It failed to surpass them and is struggling for growth towards the upper boundary. Further increase is possible in case OPEC and other oil producers sign the oil production “freeze” deal.
- Parabolic gives bullish signal.
- Bollinger bands have widened which means higher volatility.
- RSI is below 50. It has formed positive divergence.
- MACD gives bullish signals.
The bullish momentum may develop in case Brent surpasses the Thursday high of 48.3. This level may serve the point of entry. The initial stop-loss may be placed below the last fractal low, the 200-day MA, the Parabolic signal and Fibonacci line at 43.8. Having opened the pending order, we shall more the stop to the next fractal low following the Bollinger and Parabolic signals. Thus, we are changing the probable profit/loss ratio to the breakeven point. The most risk-averse traders may switch to the 4-hour chart after the trade and place there a stop-loss moving it in the direction of the trade. If the price meets the stop-loss level at 43.8 without reaching the order at 48.3, we recommend cancelling the position: the market sustains internal changes which were not taken into account.
Summary of technical analysis
| Position | Buy |
| Buy stop | above 48.3 |
| Stop loss | below 43.8 |
- Get Certificate

Note:
This overview has an informative and tutorial character and is published for free. All the data, included in the overview, are received from public sources, recognized as more or less reliable. Moreover, there is no guarantee that the indicated information is full and precise. Overviews are not updated. The whole information in each overview, including opinion, indicators, charts and anything else, is provided only for familiarization purposes and is not financial advice or а recommendation. The whole text and its any part, as well as the charts cannot be considered as an offer to make a deal with any asset. IFC Markets and its employees under any circumstances are not liable for any action taken by someone else during or after reading the overview.
