- Analytics
- Technical Analysis
Arabica Coffee Technical Analysis - Arabica Coffee Trading: 2016-11-14
Weaker Brazilian real weighs on coffee
Brazilian real slumped almost 8% as US dollar strengthened in the aftermath of US presidential elections. This caused significant decline in global coffee prices. Will the downward retracement persist?
Coffee rose in price by 50% in recent 7 months on drought and expected lower crops. Brazil accounts for about one third of global coffee production. its GDP slumped 3.8% in Q2 2016 on an annual basis. Brazilian Central Bank added $750mln to the economy this week which failed to give strong support to real. Brazil’s association of coffee exporters Cecafe reported exports of green coffee rose in October to 2.89mln 60-kg bales from 2.68mln in September. Additional negative came from Vietnam Coffee and Cocoa Association. Previously it forecasted coffee crops to fall 20-25% in 2016/17, but last week said they will fall just 10-20%. Vietnam accounts for around 20% of global coffee crops.
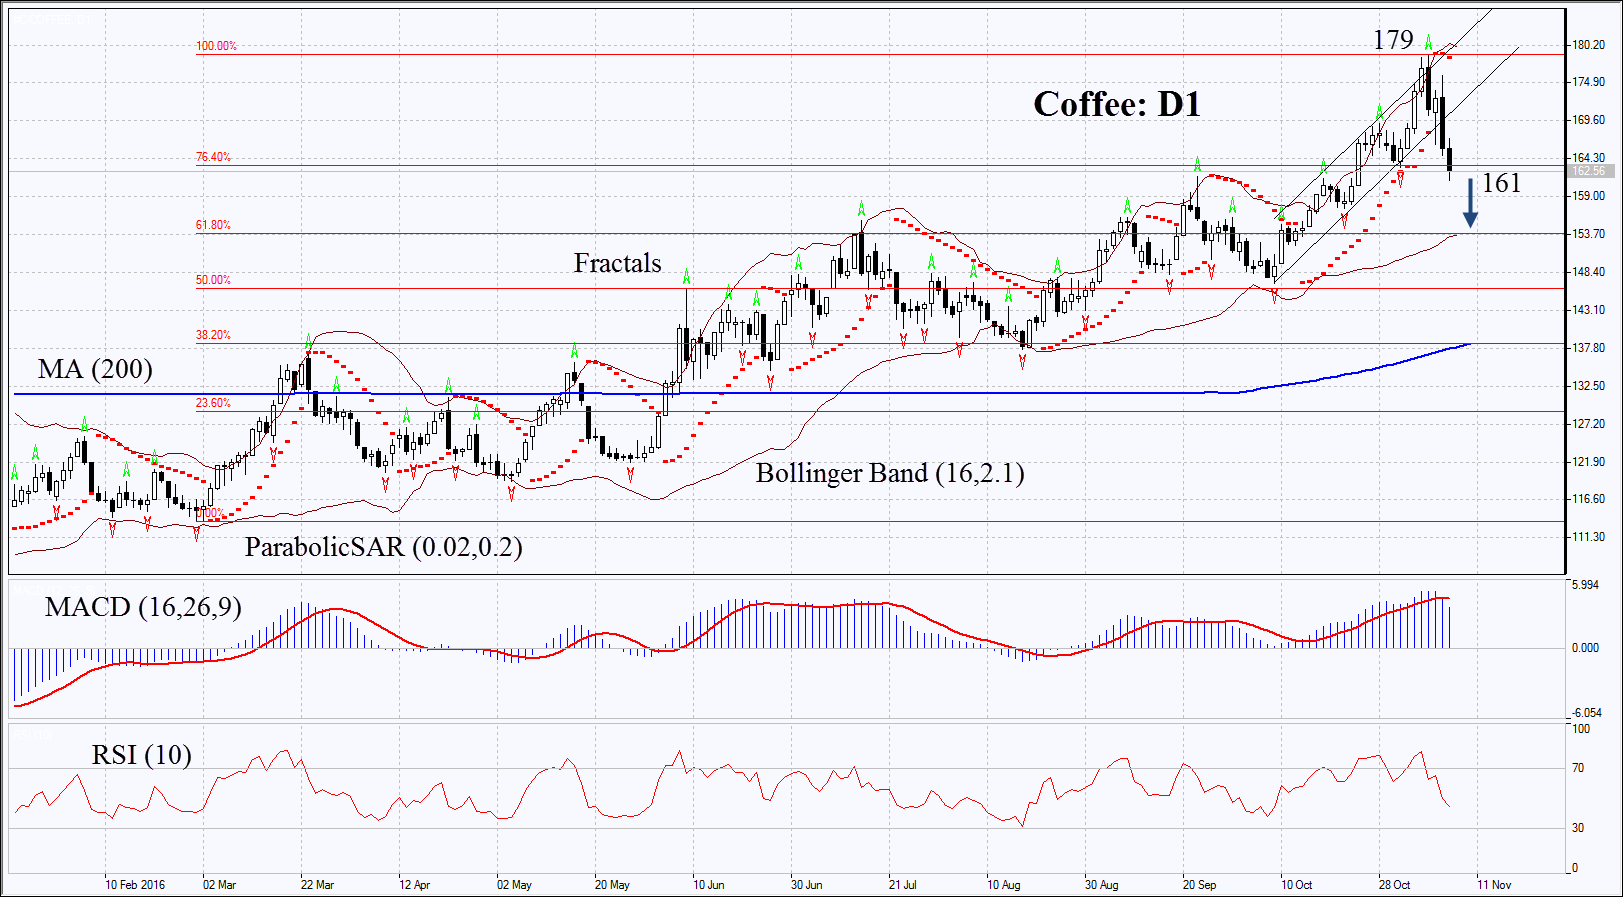
On the daily chart Coffee: D1 is correcting down after strong growth. Its further decline is possible in case Brazilian real continues weakening and in case the global crops outlook is to be revised up.
- Parabolic gives signal to sell.
- Bollinger bands have widened a lot which means higher volatility. They are tilted downward.
- RSI is below 50 but is far from the oversold zone, no divergence.
- MACD gives bearish signals.
The bearish momentum may develop in case Coffee falls below the Friday low, the last fractal low and the 1st Fibonacci level at 161. This level may serve the point of entry. The initial stop-loss may be placed above the 2-year high, last fractal high and Parabolic signal at 179. Having opened the pending order we shall move the stop to the next fractal high following the Parabolic and Bollinger signals. Thus, we are changing the probable profit/loss ratio to the breakeven point. The most risk-averse traders may switch to the 4-hour chart after the trade and place there a stop-loss moving it in the direction of the trade. If the price meets the stop-loss level at 179 without reaching the order at 161, we recommend cancelling the position: the market sustains internal changes which were not taken into account.
Summary of technical analysis
| Position | Sell |
| Sell stop | below 161 |
| Stop loss | above 179 |
- Get Certificate

Note:
This overview has an informative and tutorial character and is published for free. All the data, included in the overview, are received from public sources, recognized as more or less reliable. Moreover, there is no guarantee that the indicated information is full and precise. Overviews are not updated. The whole information in each overview, including opinion, indicators, charts and anything else, is provided only for familiarization purposes and is not financial advice or а recommendation. The whole text and its any part, as well as the charts cannot be considered as an offer to make a deal with any asset. IFC Markets and its employees under any circumstances are not liable for any action taken by someone else during or after reading the overview.
