- Analytics
- Technical Analysis
Dow Jones Index Technical Analysis - Dow Jones Index Trading: 2017-11-14
Tax cuts delay may trigger a correction
As a result of the last week the US stock index Dow Jones fell for the first time in 9 weeks. Will its downward correction continue?
The US President Donald Trump’s tax reform may be significantly reduced, as well as postponed for a year. Meanwhile, after his victory in the elections last November, Dow Jones grew by almost 30%. Investors expected that tax reduction would significantly improve the financial performance of the US corporations. Another negative factor for the stock market may be the next Fed rate hike at its regular meeting on December 13, 2017. It will contribute to an increase in the loan debt burden. In particular, the president of Philadelphia Federal Reserve Bank Patrick Harker said he would support the Fed rate hike decision. Similar opinions are expressed by other Federal Reserve Bank presidents. The P/E ratio (stock price/earnings per share for a year) reached 18, which is the highest since 2004. High P/E ratio usually indicates that stocks are overvalued.
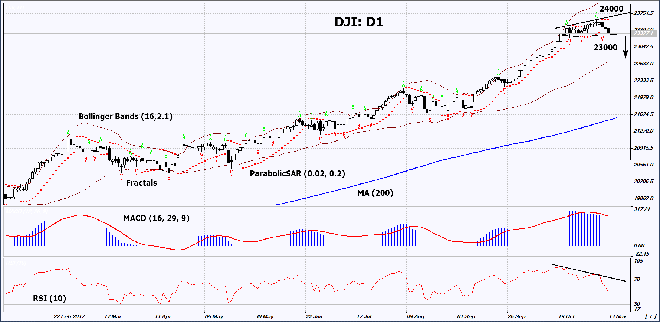
On the daily timeframe, DJI: D1 remains in the rising trend. The growth of its prices has slowed down and some technical analysis indicators formed bearish signals. A downward correction is possible in case of the publication of negative economic and corporate information in the US, the further increase of the Fed rate and the refusal from the tax reform.
- The Parabolic indicator gives a bearish signal.
- The Bollinger bands have narrowed, which means lower volatility. They are tilted down.
- The RSI indicator is above 50. It has formed a negative divergence.
- The MACD indicator gives a bearish signal.
The bearish momentum may develop in case DJI drops below the three last fractal lows at 23000. This level may serve as an entry point. The initial stop loss may be placed above the last fractal high, the historic high, the upper Bollinger band and the Parabolic signal at 24000. After opening the pending order, we shall move the stop to the next fractal high following the Bollinger and Parabolic signals. Thus, we are changing the potential profit/loss to the breakeven point. More risk-averse traders may switch to the 4-hour chart after the trade and place there a stop loss moving it in the direction of the trade. If the price meets the stop level at 24000 without reaching the order at 23000, we recommend cancelling the position: the market sustains internal changes that were not taken into account.
Summary of technical analysis
| Position | Sell |
| Sell stop | below 23000 |
| Stop loss | above 24000 |
- Get Certificate

Note:
This overview has an informative and tutorial character and is published for free. All the data, included in the overview, are received from public sources, recognized as more or less reliable. Moreover, there is no guarantee that the indicated information is full and precise. Overviews are not updated. The whole information in each overview, including opinion, indicators, charts and anything else, is provided only for familiarization purposes and is not financial advice or а recommendation. The whole text and its any part, as well as the charts cannot be considered as an offer to make a deal with any asset. IFC Markets and its employees under any circumstances are not liable for any action taken by someone else during or after reading the overview.
