- Analytics
- Technical Analysis
EUR NZD Technical Analysis - EUR NZD Trading: 2019-03-01
Preparing for the ECB meeting
In this review, we would like to draw your attention to the chart of the euro vs the New Zealand dollar currency pair. Will the EURNZD rise?
Such dynamics are observed in case of the strengthening of the euro and the weakening of the New Zealand dollar. Macroeconomic indicators of the Eurozone demonstrate an upward tendency, which may encourage investors to buy the single European currency. The main risk for the euro is the next ECB meeting during which, the plans of the launch of money emission for the TLTRO asset purchase program can be announced. It will take place on March 7. No changes in ECB rates are expected. A negative factor for the New Zealand dollar may be the desire of the Reserve Bank of New Zealand to tighten its capital requirements for local banks (Tier 1 Capital). In addition, an increase in the foreign trade deficit of New Zealand in January may contribute to its weakening. Let us note that a negative foreign trade balance has been observed since 2014.
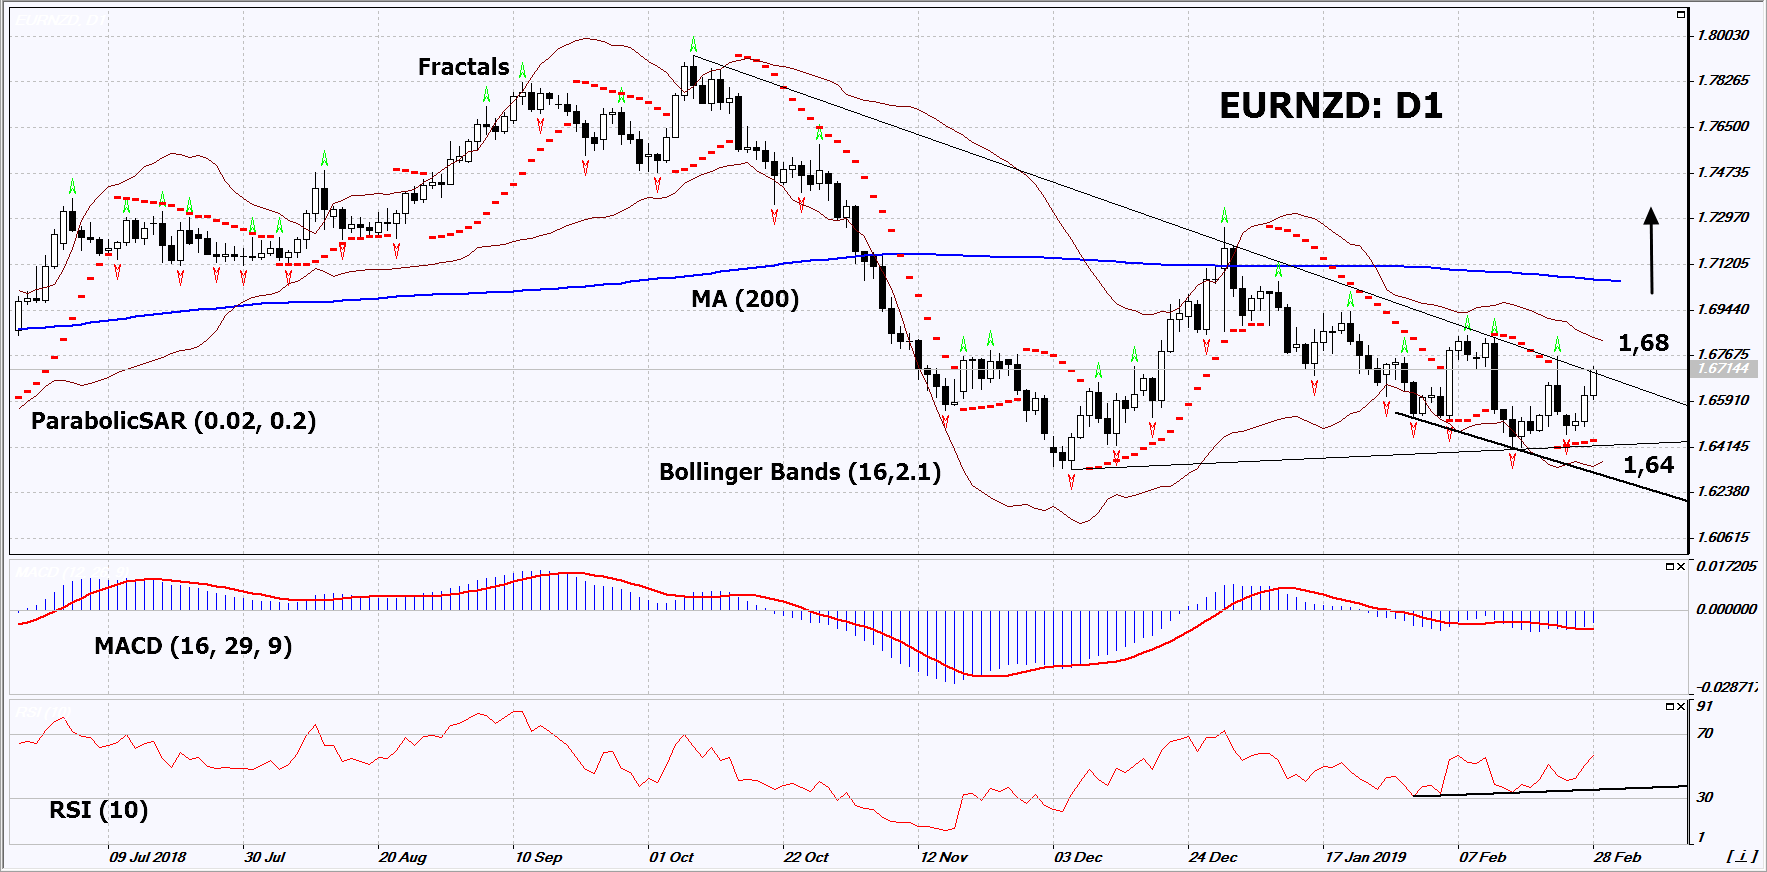
On the daily timeframe, EURNZD: D1 is trying to breach up the resistance line of the downtrend. Most technical analysis indicators formed buy signals. The further price increase is possible if the ECB postpones the easing of monetary policy.
- The Parabolic Indicator gives a bullish signal.
- The Bollinger bands have widened, which indicates high volatility. The lower Bollinger band is titled upward.
- The RSI indicator is above 50. It has formed a positive divergence.
- The MACD indicator gives a bullish signal.
The bullish momentum may develop in case EURNZD exceeds the upper Bollinger band, its last fractal high and the resistance line of the downtrend at 1.68. This level may serve as an entry point. The initial stop loss may be placed below the two last fractal lows and the Parabolic signal at 1.64. After opening the pending order, we shall move the stop to the next fractal low following the Bollinger and Parabolic signals. Thus, we are changing the potential profit/loss to the breakeven point. More risk-averse traders may switch to the 4-hour chart after the trade and place there a stop loss moving it in the direction of the trade. If the price meets the stop level (1.64) without reaching the order (1.68), we recommend to close the position: the market sustains internal changes that were not taken into account.
Summary of technical analysis
| Position | Buy |
| Buy stop | Above 1.68 |
| Stop loss | Below 1.64 |
- Get Certificate

Note:
This overview has an informative and tutorial character and is published for free. All the data, included in the overview, are received from public sources, recognized as more or less reliable. Moreover, there is no guarantee that the indicated information is full and precise. Overviews are not updated. The whole information in each overview, including opinion, indicators, charts and anything else, is provided only for familiarization purposes and is not financial advice or а recommendation. The whole text and its any part, as well as the charts cannot be considered as an offer to make a deal with any asset. IFC Markets and its employees under any circumstances are not liable for any action taken by someone else during or after reading the overview.
