- Analytics
- Technical Analysis
FR 40 Technical Analysis - FR 40 Trading: 2018-05-18
Improving data bullish for FR40
Expansion in French manufacturing and services sectors accelerated in April. Will the FR 40 continue advancing?
Recent French economic data were positive after the economy slowed down in the first quarter as GDP grew by 0.3% over quarter in the three months to March 2018 after 0.7% expansion in Q4 2017. The composite purchasing managers’ index reported by Markit rose to 56.9 in April from 56.3, indicating expansion in economic activities in April, and the consumer prices inflation slowed less than expected in April. At the same time Insee, the French statistics agency, revised up its estimate of the country's 2017 economic output: to 2.2% growth from 2016 instead of the 2% previous estimate. Improving economic data are bullish for French stock index FR 40.
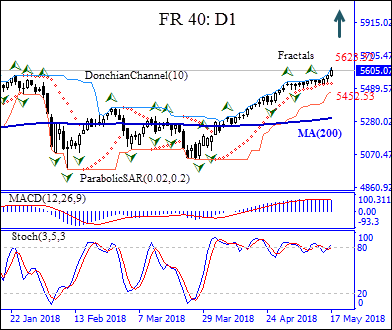
On the daily timeframe the FR40: D1 is above the 200-day moving average MA(200) which is rising, this is bullish.
- The Parabolic indicator gives a buy signal.
- The Donchian channel indicates uptrend: it is tilted up.
- The MACD indicator gives a nuetral signal: it is above the signal line and the gap is steady.
- The Stochastic oscillator has breached into the overbought zone, this is bearish.
We believe the bullish momentum will continue after the price closes above the upper boundary of Donchian channel at 5623.32. This level can be used as an entry point for placing a pending order to buy. The stop loss can be placed below the last fractal low at 5452.53. After placing the order, the stop loss is to be moved every day to the next fractal low, following Parabolic signals. Thus, we are changing the probable profit/loss ratio to the breakeven point. If the price meets the stop loss level (5452.53) without reaching the order (5623.32), we recommend cancelling the order: the market has undergone internal changes which were not taken into account.
Technical Analysis Summary
| Position | Buy |
| Buy stop | Above 5623.32 |
| Stop loss | Below 5452.53 |
- Get Certificate

Note:
This overview has an informative and tutorial character and is published for free. All the data, included in the overview, are received from public sources, recognized as more or less reliable. Moreover, there is no guarantee that the indicated information is full and precise. Overviews are not updated. The whole information in each overview, including opinion, indicators, charts and anything else, is provided only for familiarization purposes and is not financial advice or а recommendation. The whole text and its any part, as well as the charts cannot be considered as an offer to make a deal with any asset. IFC Markets and its employees under any circumstances are not liable for any action taken by someone else during or after reading the overview.
