- Analytics
- Technical Analysis
GBP NZD Technical Analysis - GBP NZD Trading: 2019-02-27
Brexit dates may be postponed
In this review, we would like to draw your attention to the chart of the British pound vs the New Zealand dollar currency pair. Will the GBPNZD rise?
Such dynamics indicate the strengthening of the pound against the New Zealand dollar. The main positive factor for the British currency is the plan of Prime Minister Theresa May to postpone the UK's exit date from the EU for a few months. This event is scheduled for March 29, 2019. The next vote on the postponement of Brexit will be held in the British Parliament on March 12. Investors believe that due to the postponement of the exit date, the UK will be able to negotiate with the EU over much more favorable conditions in comparison with the so-called No-deal Brexit, which currently exists. Good economic data on lower inflation and an increase in retail sales in the UK in January became positive factors for the pound. In turn, a negative factor for the New Zealand dollar may be the desire of the Reserve Bank of New Zealand to tighten its capital requirements for local banks (Tier 1 Capital).
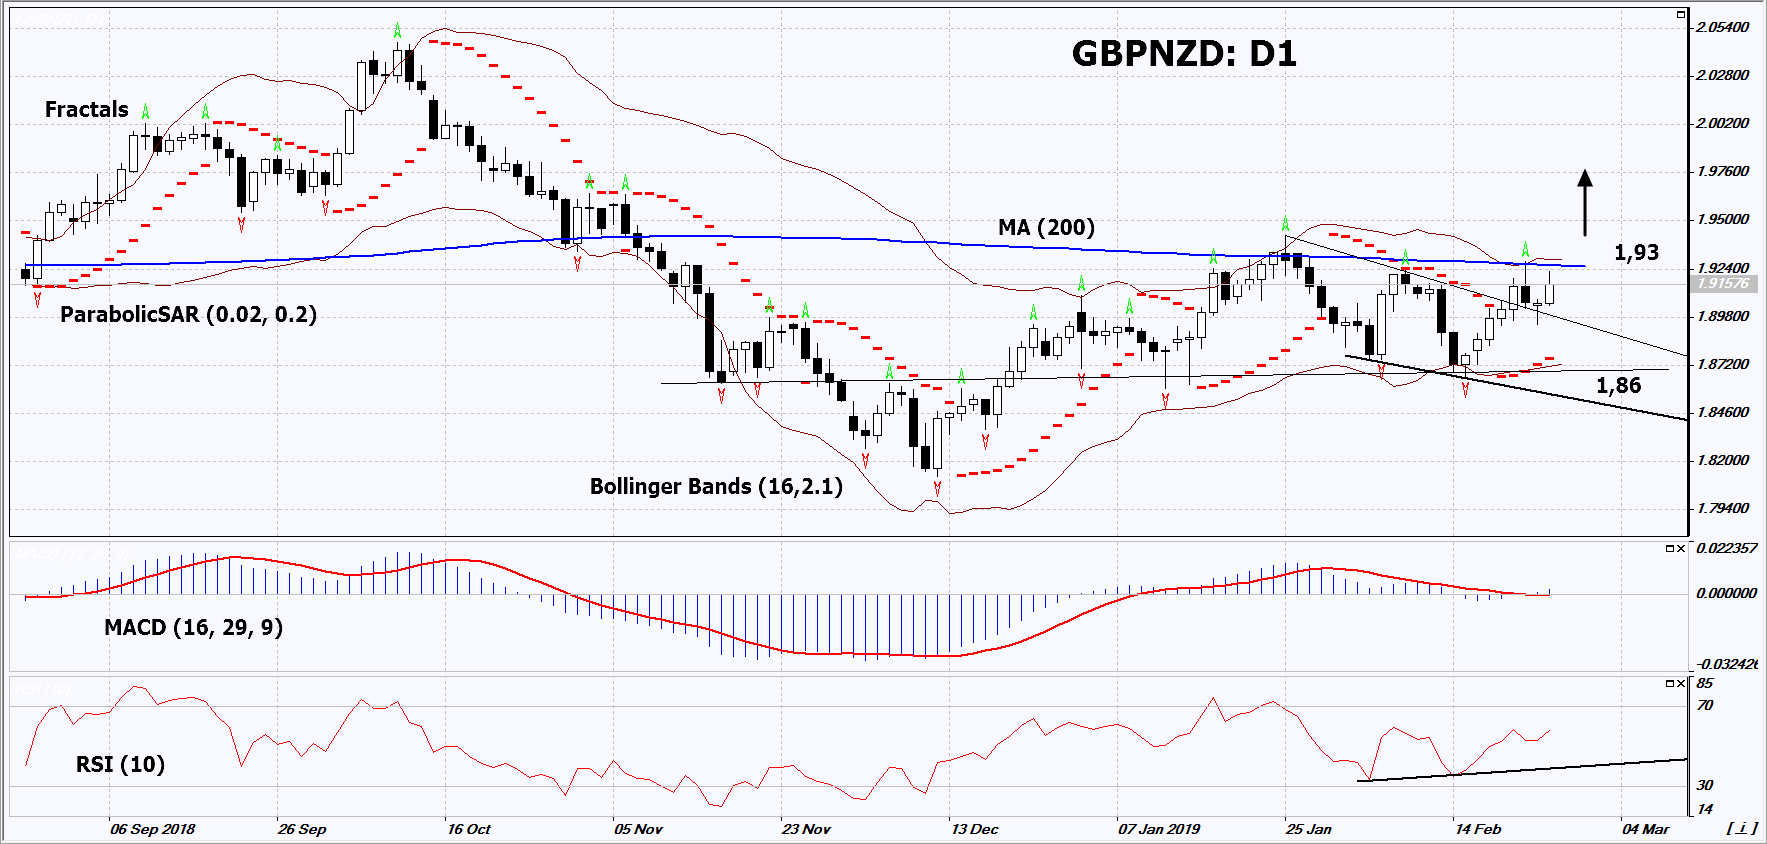
On the daily timeframe, GBPNZD: D1 is in a neutral trend. A number of technical analysis indicators formed buy signals. The further price increase is possible in case of the settlement of Brexit.
- The Parabolic Indicator gives a bullish signal.
- The Bollinger bands have narrowed, which indicates low volatility. Both Bollinger bands are titled upward.
- The RSI indicator is above 50. It has formed a positive divergence.
- The MACD indicator gives a bullish signal.
The bullish momentum may develop in case GBPNZD exceeds the upper Bollinger band, the last fractal high and the 200-day moving average line at 1.93. This level may serve as an entry point. The initial stop loss may be placed below the last fractal low, the Parabolic signal and the lower Bollinger band at 1.86. After opening the pending order, we shall move the stop to the next fractal low following the Bollinger and Parabolic signals. Thus, we are changing the potential profit/loss to the breakeven point. More risk-averse traders may switch to the 4-hour chart after the trade and place there a stop loss moving it in the direction of the trade. If the price meets the stop level (1.86) without reaching the order (1.93), we recommend to close the position: the market sustains internal changes that were not taken into account.
Summary of technical analysis
| Position | Buy |
| Buy stop | Above 1.93 |
| Stop loss | Below 1.86 |
- Get Certificate

Note:
This overview has an informative and tutorial character and is published for free. All the data, included in the overview, are received from public sources, recognized as more or less reliable. Moreover, there is no guarantee that the indicated information is full and precise. Overviews are not updated. The whole information in each overview, including opinion, indicators, charts and anything else, is provided only for familiarization purposes and is not financial advice or а recommendation. The whole text and its any part, as well as the charts cannot be considered as an offer to make a deal with any asset. IFC Markets and its employees under any circumstances are not liable for any action taken by someone else during or after reading the overview.
