- Analytics
- Technical Analysis
Hog Futures Technical Analysis - Hog Futures Trading: 2018-08-14
The US and Mexico held another round of NAFTA negotiations
US President Donald Trump about the progress in trade negotiations with Mexico. Earlier, Mexico was going to raise import duties on US pork in response to the introduction of customs barriers to the supply of Mexican products in the US. Will Lhog prices rise?
The US, Mexico and Canada are discussing a new version of the North American Free Trade Agreement (NAFTA). Over the past 2 months, the US pork price has fallen by 42% because of the risks of an increase in import duties of Mexico and China. Their growth may occur in response to an increase in US import duties on steel and aluminum. Mexico is the world's third largest importer of pork after China and Japan. Previously, Mexico acquire up to 80% of this meat in the US. On August 9, 2018, pork prices updated the 2-year low and fell to the established daily low on the US Chicago Mercantile Exchange. After that, they are trying to correct up, as some speculators are likely to close short positions amid the progress of negotiations between the US and Mexico. An additional factor for the pork price increase may be the outbreak of swine fever in China’s Liaoning province. However, it has not been widely disseminated yet.
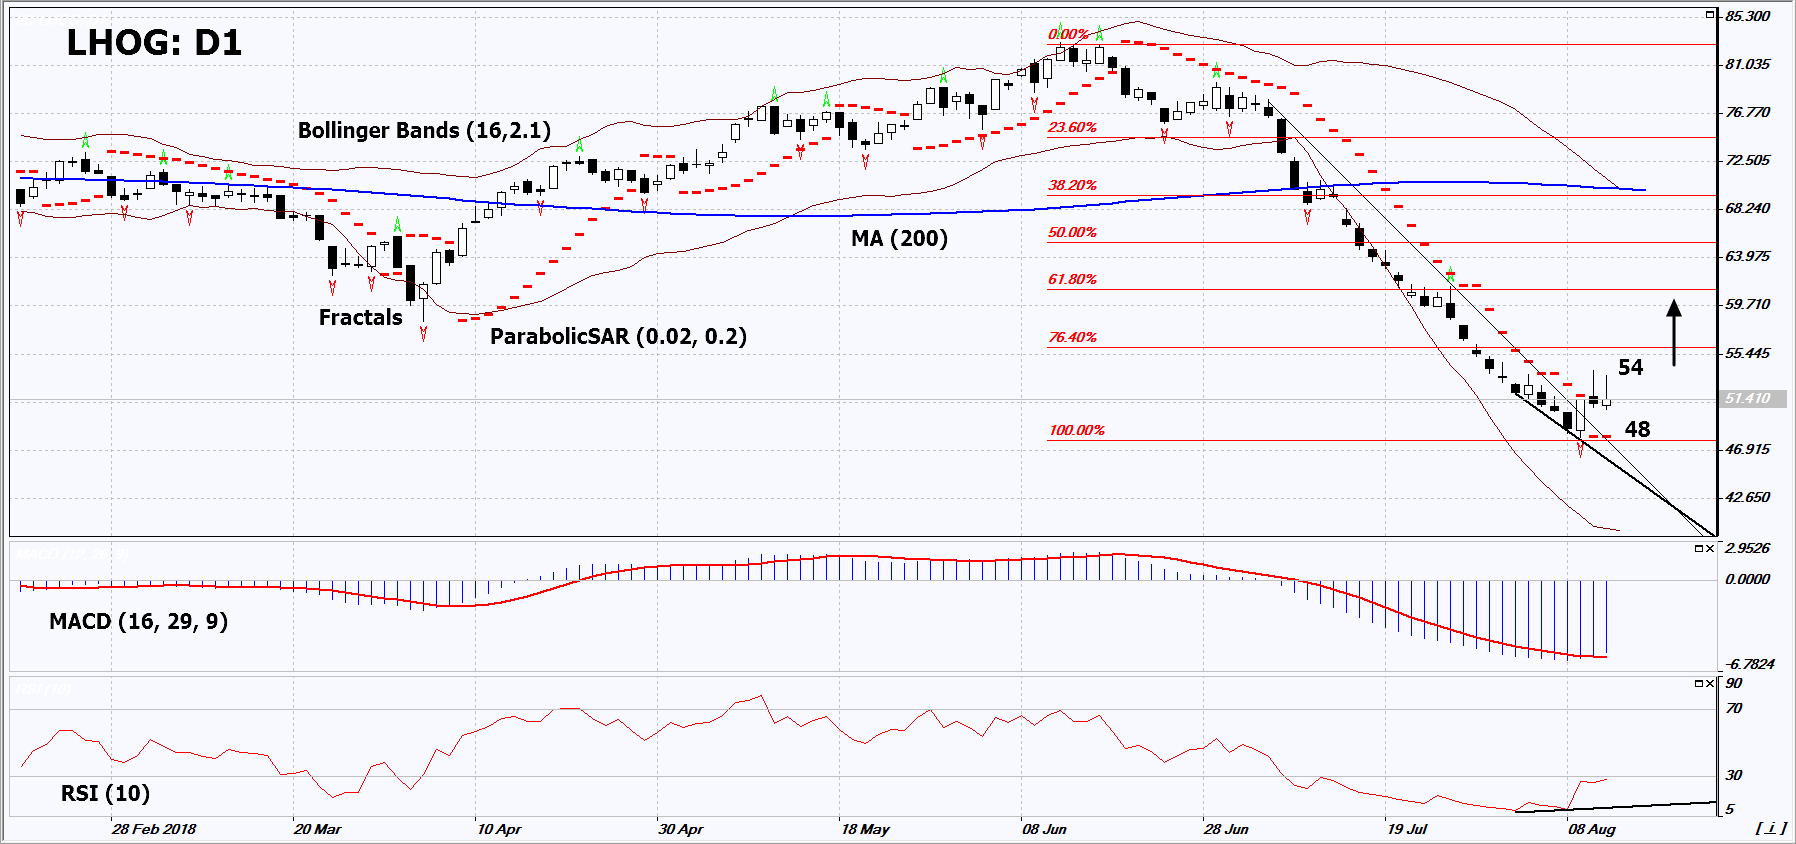
On the daily timeframe, Lhog: D1 breached up the resistance line of the downtrend and is trying to correct up from the 2-year low. The further price increase is possible in case of the resumption of demand for US pork.
- The Parabolic indicator gives a bullish signal.
- The Bollinger bands have widened, which indicates high volatility.
- The RSI indicator is below 50. It has formed a positive divergence.
- The MACD indicator gives a bullish signal.
The bullish momentum may develop in case Lhog exceeds the last high at 54. This level may serve as an entry point. The initial stop loss may be placed below the last fractal low, the Parabolic signal and the 2-year low at 48. After opening the pending order, we shall move the stop to the next fractal low following the Bollinger and Parabolic signals. Thus, we are changing the potential profit/loss to the breakeven point. More risk-averse traders may switch to the 4-hour chart after the trade and place there a stop loss moving it in the direction of the trade. If the price meets the stop level (48) without reaching the order (54), we recommend to close the position: the market sustains internal changes that were not taken into account.
Summary of technical analysis
| Position | Buy |
| Buy stop | Above 54 |
| Stop loss | Below 48 |
- Get Certificate

Note:
This overview has an informative and tutorial character and is published for free. All the data, included in the overview, are received from public sources, recognized as more or less reliable. Moreover, there is no guarantee that the indicated information is full and precise. Overviews are not updated. The whole information in each overview, including opinion, indicators, charts and anything else, is provided only for familiarization purposes and is not financial advice or а recommendation. The whole text and its any part, as well as the charts cannot be considered as an offer to make a deal with any asset. IFC Markets and its employees under any circumstances are not liable for any action taken by someone else during or after reading the overview.
