- Analytics
- Technical Analysis
Nasdaq 100 Technical Analysis - Nasdaq 100 Trading: 2016-12-12
Nasdaq 100 falls behind in growth
Hi-tech Nasdaq 100 falls in growth behind other US stock market indices. Will it continue advancing? Dow, S&P 500 and Nasdaq Composite have already hit their fresh historical highs.
Main reason for stock market “rally” is that investors believe that economic reforms of US president Donald Trump may hinder increase of US industrial production. Previously Trump outlined the main vectors of his program for the first 100 days of presidency. The US payrolls shall rise due to reshoring and withdrawal from TPP, public administration system shall be reformed by bans on some lobbying and illegal immigration shall be fought. He also plans in future to cut corporate taxes. Positive economic data pushed US stock market indices up. Consumer sentiment index by Michigan University for December came out positive reaching 98 points, its high since January 2015. Factory orders for October came out positive on Wednesday. We would like to outline the main reasons that limit increase of Nasdaq 100 index. The US Fed meets on December 14, 2016 where the interest rate is to be hiked 0.25%. The likelihood of such an event is 94%, according to interest rate futures. Higher rates will raise the credit burden on US hi-tech companies. Another factor is the absence of financials in Nasdaq 100 index. Financial stocks advanced ahead of rate hike which pushed up other stock indices. Since the start of the year Nasdaq 100 advanced 6.4% while S&P 500 soared 10.2% and Dow Jones added 12.9%. Now Nasdaq 100 is traded with Р/Е ratio of 23.3. It is historically above the similar ratio for other indices. For S&P 500 Р/Е ratio is 20.5 while for Dow Jones it is 19.8. As a rule, lower Р/Е means higher growth potential for indices and particular stocks.
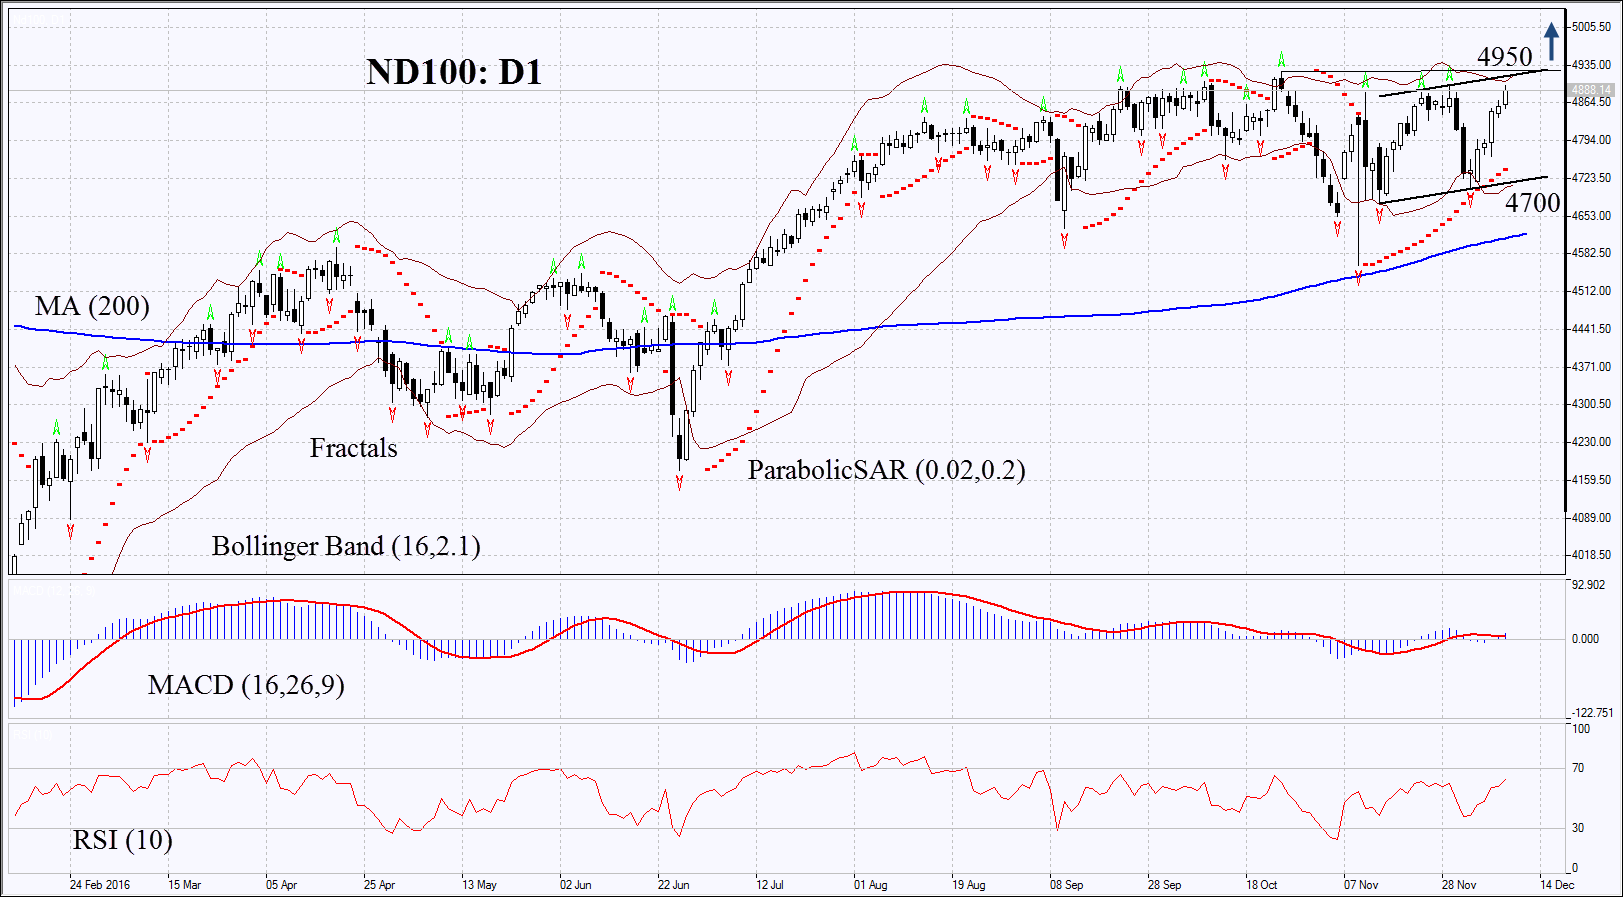
On the daily chart ND100: D1 is moving towards the resistance of the uptrend but has not overcome it yet. Further price increase is possible in case of strong economic and corporate data in US.
- Parabolic gives bullish signal.
- Bollinger bands have narrowed which means low volatility.
- RSI has surpassed the level of 50 but has not yet reached the overbought zone. No divergence.
- MACD gives bullish signal.
The bullish momentum may develop in case ND100 surpasses the last fractal highs, historical high and the upper Bollinger band at 4950. This level may serve the point of entry. The initial stop-loss may be placed below the last fractal low, the Parabolic signal, the Bollinger band and the support of the rising trend at 4700. Having opened the pending order we shall move the stop to the next fractal low following the Parabolic and Bollinger signals. Thus, we are changing the probable profit/loss ratio to the breakeven point. The most risk-averse traders may switch to the 4-hour chart after the trade and place there a stop-loss moving it in the direction of the trade. If the price meets the stop-loss level at 4700 without reaching the order at 4950, we recommend cancelling the position: the market sustains internal changes which were not taken into account.
Summary of technical analysis
| Position | Buy |
| Buy stop | above 4950 |
| Stop loss | below 4700 |
- Get Certificate

Note:
This overview has an informative and tutorial character and is published for free. All the data, included in the overview, are received from public sources, recognized as more or less reliable. Moreover, there is no guarantee that the indicated information is full and precise. Overviews are not updated. The whole information in each overview, including opinion, indicators, charts and anything else, is provided only for familiarization purposes and is not financial advice or а recommendation. The whole text and its any part, as well as the charts cannot be considered as an offer to make a deal with any asset. IFC Markets and its employees under any circumstances are not liable for any action taken by someone else during or after reading the overview.
