- Analytics
- Technical Analysis
Nasdaq 100 Technical Analysis - Nasdaq 100 Trading: 2018-06-15
Positive data bullish for ND100
Expanding US business activity and retail sales support market sentiment. Will ND100 continue rising?
US economic data in the last couple of weeks were strong: the growth of personal income and personal spending accelerated in April, and nonfarm payrolls rose more in May compared with April. And while factory orders fell in April due to decline in aircraft orders, both the ISM Manufacturing and Non-Manufacturing PMIs rose in May. And the retail sales increase over month in May was bigger than that of in April. Expanding manufacturing and services sectors and rising retail sales are bullish for US stocks.
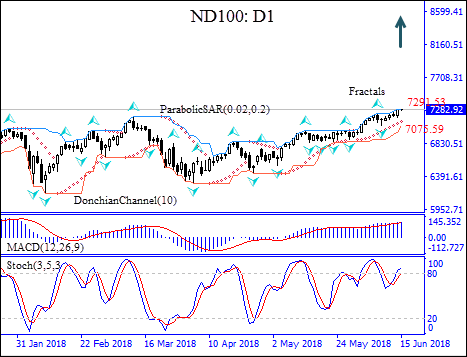
On the daily chart the ND100: D1 has been rising after hitting eight-month low in February.
- The Donchian channel indicates uptrend: it is tilted higher.
- The Parabolic indicator has formed a buy signal.
- The MACD indicator is above the signal line and the gap is widening, which is a bullish signal.
- The stochastic oscillator has breached into the overbought zone, this is bearish.
We believe the bullish momentum will continue after the price closes above the upper Donchain channel at 7291.53. A price above that level can be used as an entry point for a pending order to buy. The stop loss can be placed below the last fractal low at 7075.59. After placing the pending order the stop loss is to be moved every day to the next fractal low, following Parabolic signals. Thus, we are changing the probable profit/loss ratio to the breakeven point. More conservative traders can switch to the 4-hour chart and move the stop-loss in the direction of the trade. If the price meets the stop loss level (7075.59) without reaching the order(7291.53), we recommend cancelling the order: the market sustains internal changes which were not considered.
Technical Analysis Summary
| Position | Buy |
| Buy stop | Above 7291.53 |
| Stop loss | Below 7075.59 |
- Get Certificate

Note:
This overview has an informative and tutorial character and is published for free. All the data, included in the overview, are received from public sources, recognized as more or less reliable. Moreover, there is no guarantee that the indicated information is full and precise. Overviews are not updated. The whole information in each overview, including opinion, indicators, charts and anything else, is provided only for familiarization purposes and is not financial advice or а recommendation. The whole text and its any part, as well as the charts cannot be considered as an offer to make a deal with any asset. IFC Markets and its employees under any circumstances are not liable for any action taken by someone else during or after reading the overview.
