- Analytics
- Technical Analysis
FMCG Stocks Technical Analysis - FMCG Stocks Trading: 2018-04-18
Investors expect an increase in profits of S&P 500 companies
In this review, we suggest considering the personal composite instrument (PCI) Non-cyclical_Stocks – Non-Cyclical stocks. As its name suggests, it reflects the price dynamics of the portfolio composed of stocks of the world’s 6 largest companies, which produce non-cyclical goods and services. As a rule, the demand for these goods and services is stable regardless of fluctuations in economy. Will Non-cyclical_Stocks prices increase?
Currently, the quarterly earnings reports season of the US companies for the 1st quarter of 2018 has started. According to forecasts, the aggregate profit of the companies included in S&P 500 stock index will increase by 18.6%, which is the maximum for the last 7 years. Economic data in the US looks quite positive. The US GDP growth for the 4th quarter of the last year was 2.9% year-over-year. According to the forecast of IMF, it may amount to 3% in 2018.
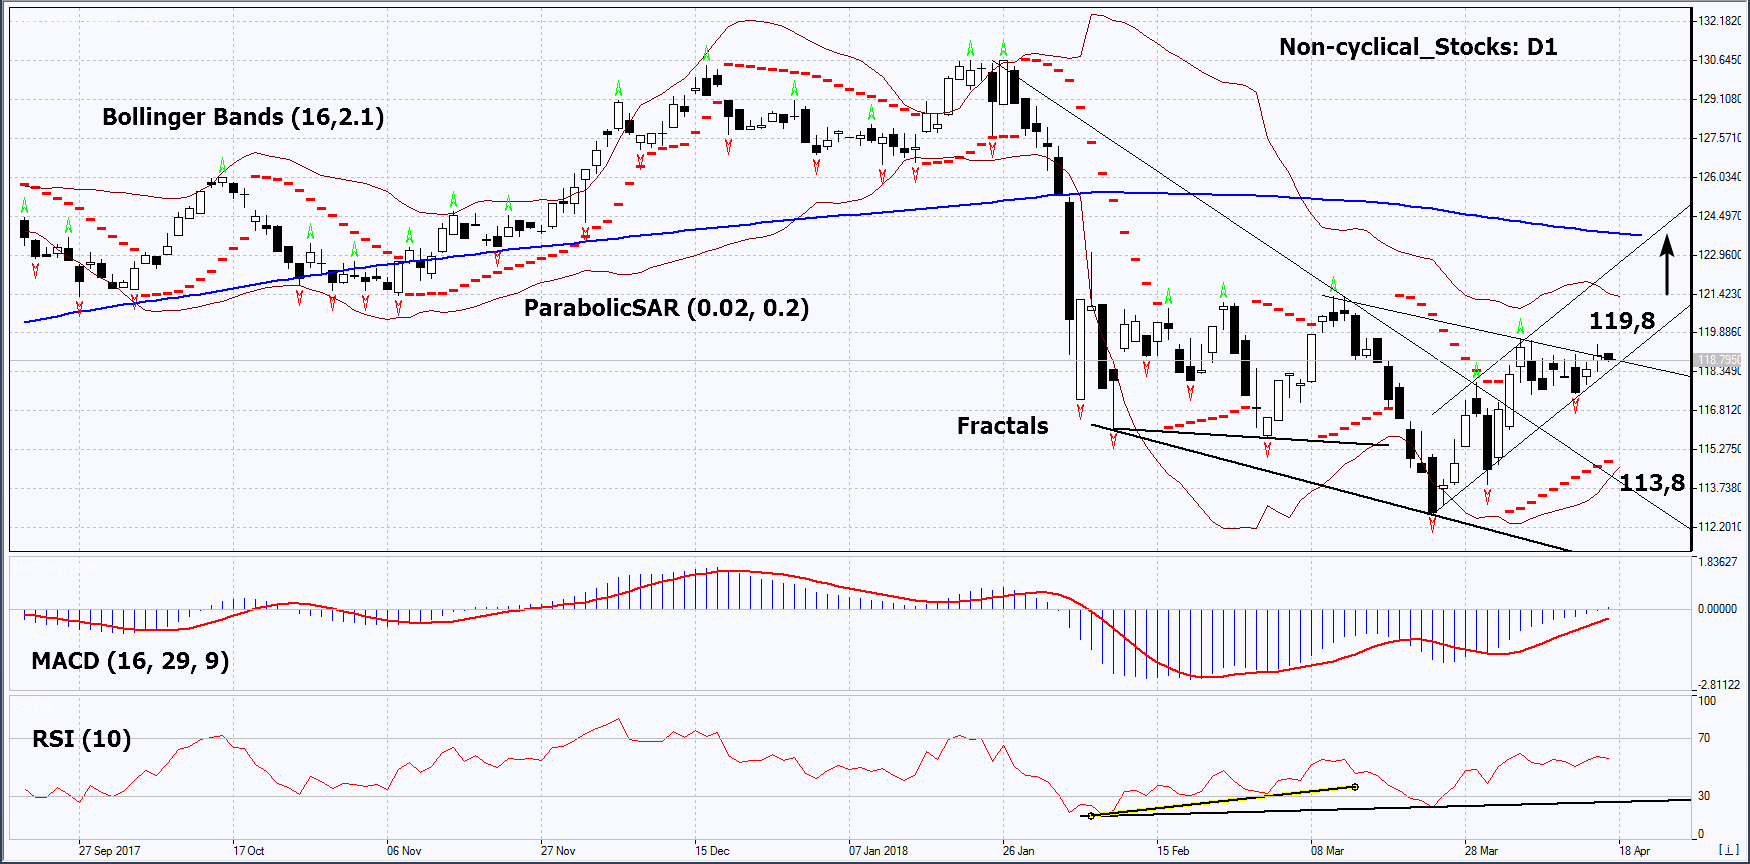
On the daily timeframe, Non-cyclical_Stocks: D1 has edged up from the downtrend. The further price increase is possible in case of positive quarterly earnings reports of the US companies.
- The Parabolic indicator gives bullish signals.
- The Bollinger bands have narrowed, which indicates low volatility. They are titled upward.
- TheRSI indicator is above 50, it has formed a positive divergence.
- TheMACD indicator is giving bullish signals.
The bullish momentum may develop in case Non-cyclical_Stocks exceeds the last fractal high and the upper Bollinger band at 119.8. This level may serve as an entry point. The initial stop loss may be placed below the two last fractal lows, the lower Bollinger band, and the Parabolic signal at 113.8. After opening the pending order, we shall move the stop to the next fractal low following the Bollinger and Parabolic signals. Thus, we are changing the potential profit/loss to the breakeven point. More risk-averse traders may switch to the 4-hour chart after the trade and place there a stop loss moving it in the direction of the trade. If the price meets the stop level at 113.8 without reaching the order at 119.8, we recommend to close the position: the market sustains internal changes that were not taken into account.
Summary of technical analysis
| Position | Buy |
| Buy stop | Above 119,8 |
| Stop loss | Below 113,8 |
- Get Certificate

Note:
This overview has an informative and tutorial character and is published for free. All the data, included in the overview, are received from public sources, recognized as more or less reliable. Moreover, there is no guarantee that the indicated information is full and precise. Overviews are not updated. The whole information in each overview, including opinion, indicators, charts and anything else, is provided only for familiarization purposes and is not financial advice or а recommendation. The whole text and its any part, as well as the charts cannot be considered as an offer to make a deal with any asset. IFC Markets and its employees under any circumstances are not liable for any action taken by someone else during or after reading the overview.
