- Analytics
- Technical Analysis
USD CHF Technical Analysis - USD CHF Trading: 2018-11-19
Fed may take a break in tightening monetary policy
US Vice Chairman Richard Clarida announced risks of a slowdown in the growth of global economy. This had a strong negative effect on the US dollar. Will the USDCHF fall?
Such a trend indicates the weakening of the US dollar against the Swiss franc. Richard Clarida said that Fed rates are approaching the neutral level. Market participants interpreted these words as a risk that the US regulator could take a break in the policy of rate hikes. Whereas previously, they were sure of their hike at the next meeting on December 19. Let us recall that US President Donald Trump has already spoken out against the further tightening of the Fed's monetary policy. This creates a negative background for the dollar. An additional negative factor was the data on the industrial production growth in October, which amounted to + 0.1%, which is worse than preliminary forecasts. Amid this, the attractiveness of the Swiss franc, which is traditionally considered as a “safe haven” asset by investors, may increase. This week, macroeconomic data will come out in Switzerland, which can affect its rate. The trade balance for October will be published on November 20, and the industrial production for the 3-1 quarter - on November 22.
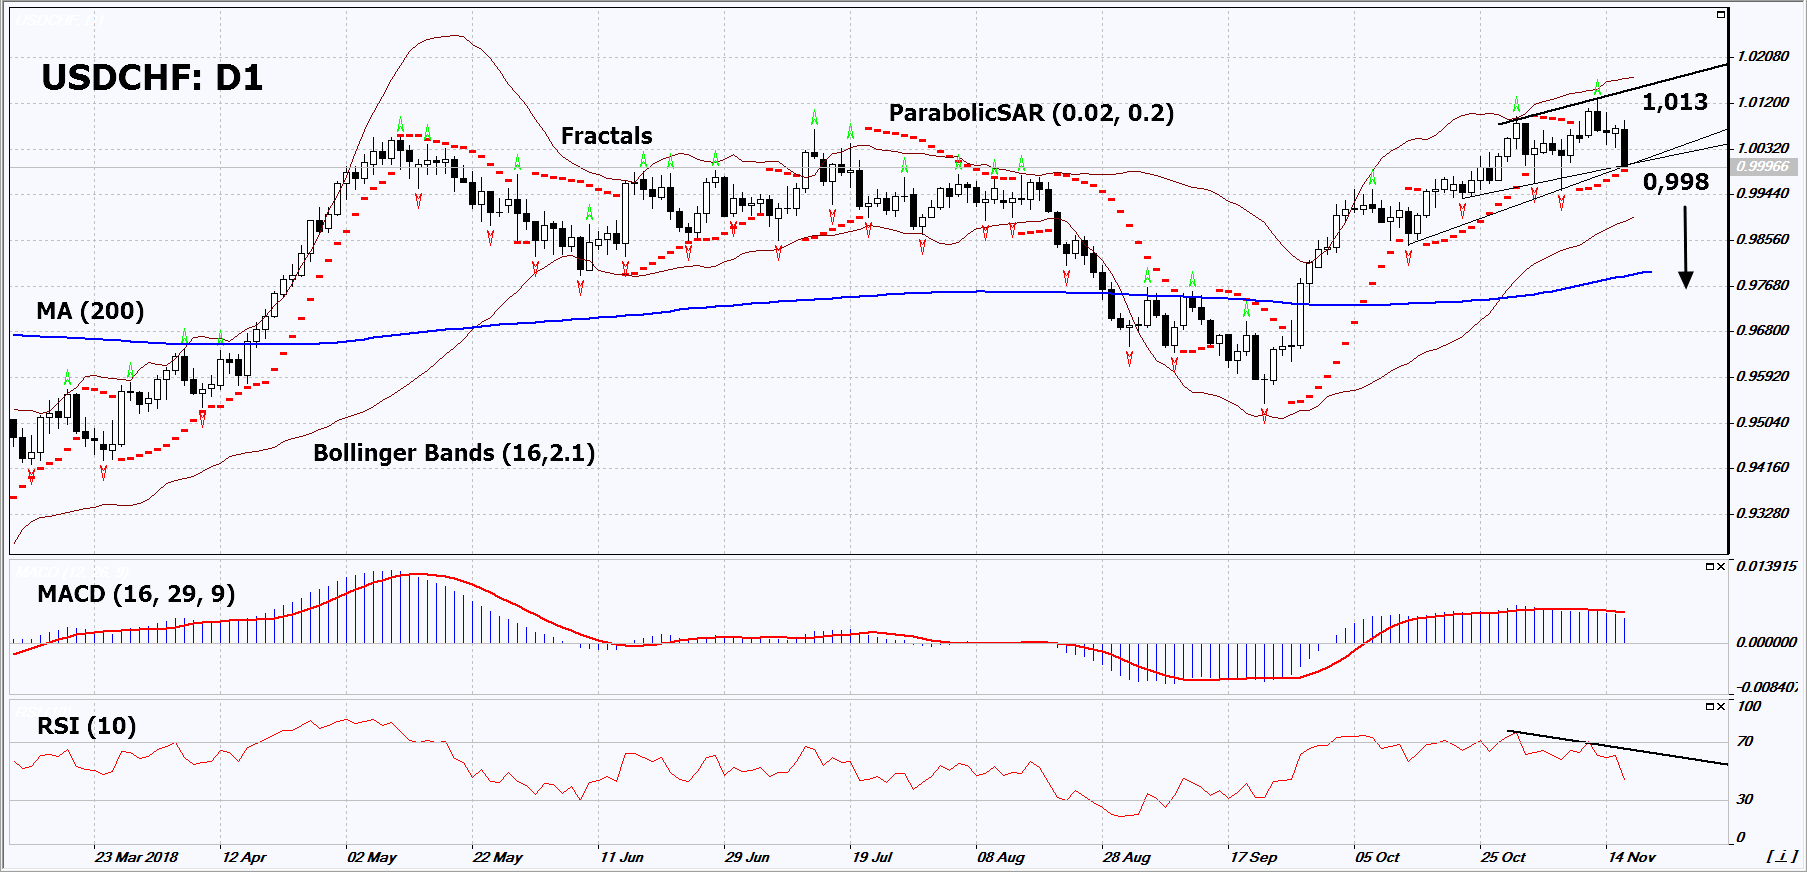
On the daily timeframe, USDCHF: D1 approached the support line of the rising trend. It should be breached down before opening a sell position. The further price decrease is possible in case of the publication of positive macroeconomic data in Switzerland.
- The Parabolic indicator gives a bullish signal. It can be used as an additional support level, which must be breached down before opening a position.
- The Bollinger bands have widened, which indicates high volatility.
- The RSI indicator is below 50. It has formed a negative divergence.
- The MACD indicator gives a bearish signal.
The bearish momentum may develop in case USDCHF falls below the Parabolic signal at 0.998. This level may serve as an entry point. The initial stop loss may be placed above the last fractal high at 1.013. After opening the pending order, we shall move the stop to the next fractal high following the Bollinger and Parabolic signals. Thus, we are changing the potential profit/loss to the breakeven point. More risk-averse traders may switch to the 4-hour chart after the trade and place there a stop loss moving it in the direction of the trade. If the price meets the stop level (1.013) without reaching the order (0.996), we recommend to close the position: the market sustains internal changes that were not taken into account.
Summary of technical analysis
| Position | Sell |
| Sell stop | Below 0.996 |
| Stop loss | Above 1.013 |
- Get Certificate

Note:
This overview has an informative and tutorial character and is published for free. All the data, included in the overview, are received from public sources, recognized as more or less reliable. Moreover, there is no guarantee that the indicated information is full and precise. Overviews are not updated. The whole information in each overview, including opinion, indicators, charts and anything else, is provided only for familiarization purposes and is not financial advice or а recommendation. The whole text and its any part, as well as the charts cannot be considered as an offer to make a deal with any asset. IFC Markets and its employees under any circumstances are not liable for any action taken by someone else during or after reading the overview.
