- Analytics
- Technical Analysis
US Dollar Index Technical Analysis - US Dollar Index Trading: 2017-05-10
Probability of Fed rate hike increased
The probability of the Fed rate hike at the next meeting on June 14, 2017 approached to 90%. Will the US dollar index grow?
The yield of the 2-year US government bonds updated the 8-week high. Meanwhile, the dollar index advanced only to the 3-week high. Theoretically, rate hike may prolong its increasing trend. The most important statistics in the US for this week will come out on Friday: inflation and retail sales. We believe that the preliminary forecasts are favorable for the further strengthening of the US dollar. Let us recall that the growth of the dollar index started on Monday due to the weakening of the euro after Emmanuel Macron’s victory in the French presidential elections.
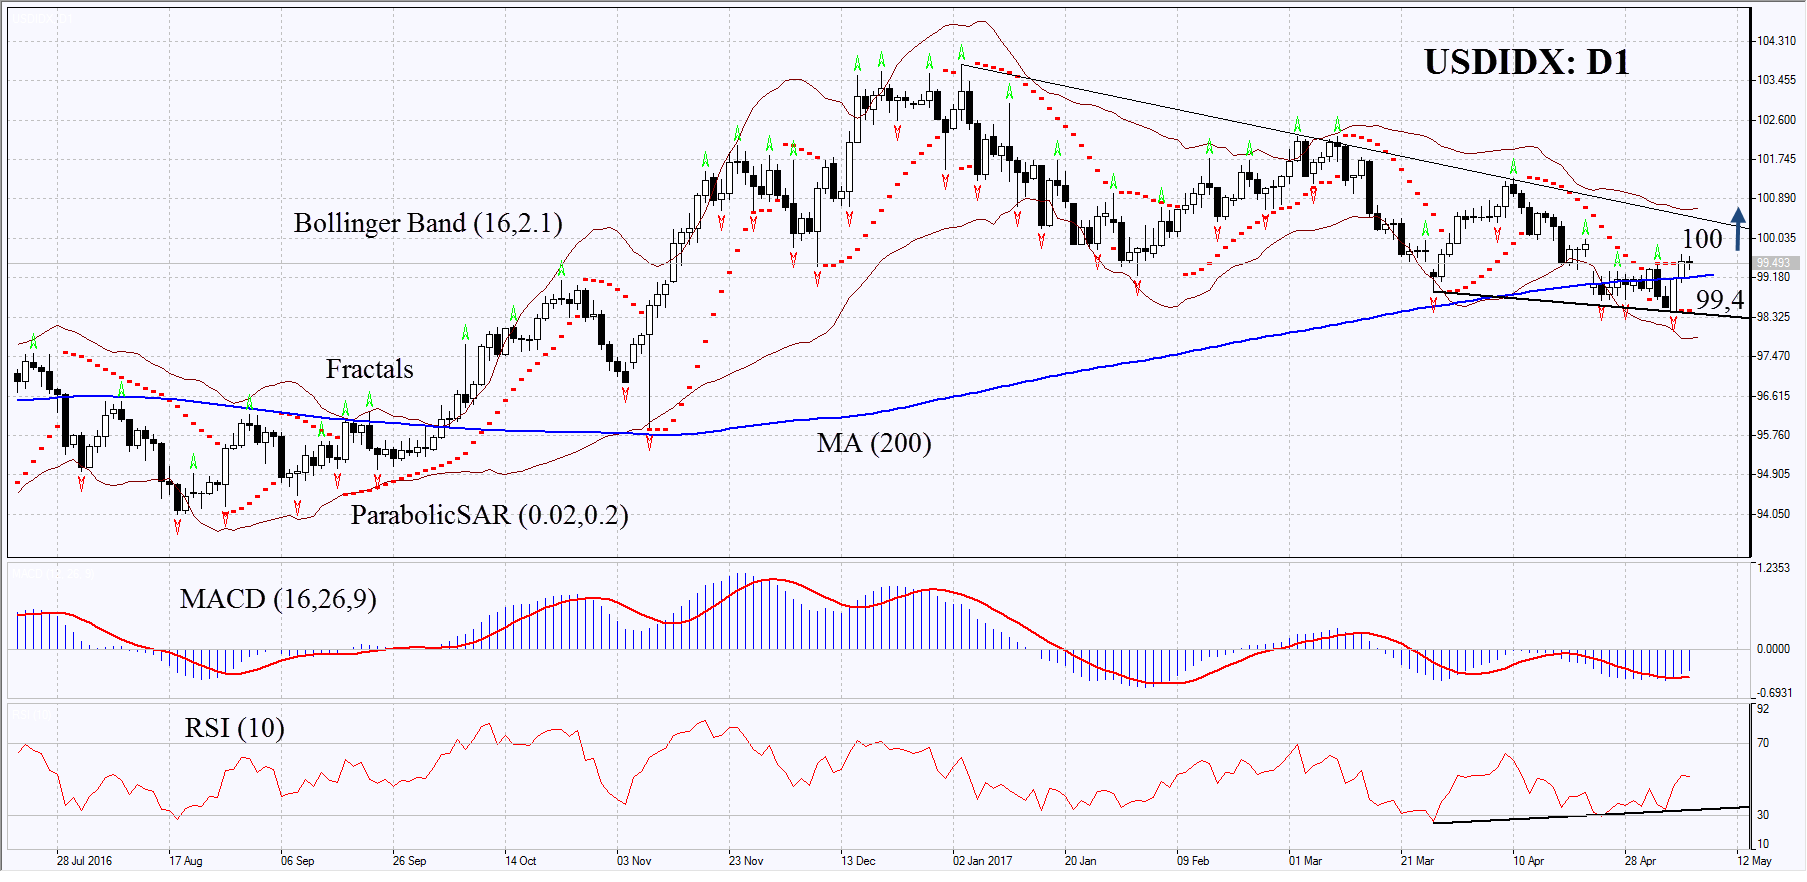
On the daily time frame, USDIDX: D1 is in a downtrend. Currently, the prices are increasing, repulsing from the lower boundary of the trend and the 200-day moving average. The further increase in possible in case of the publication of positive economic statistics in the US and negative statistics in other developed countries.
- The Parabolic indicator gives a bullish signal.
- The Bollinger bands show ordinary volatility. They are tilted upwards.
- The RSI is above 50. It has formed a positive divergence.
- The MACD gives a bullish signal.
The bullish momentum may develop in case USDIDX exceeds the 3 last fractal highs and the psychologically important level at 100. This level may serve as an entry point. The initial stop-loss may be placed below the Parabolic signal, the 200-day moving average and the last fractal low at 99.4. After opening the pending order, we shall move the stop to the next fractal low following the Bollinger and Parabolic signals. Thus, we are changing the potential profit/loss to the breakeven point. More risk-averse traders may switch to the 4-hour chart after the trade and place there a stop-loss moving it in the direction of the trade. If the price meets the stop level at 99.4 without reaching the order at 100 we recommend cancelling the position: the market sustains internal changes that were not taken into account.
Summary of technical analysis
| Position | Buy |
| Buy stop | 100 |
| Stop loss | 99,4 |
- Get Certificate

Note:
This overview has an informative and tutorial character and is published for free. All the data, included in the overview, are received from public sources, recognized as more or less reliable. Moreover, there is no guarantee that the indicated information is full and precise. Overviews are not updated. The whole information in each overview, including opinion, indicators, charts and anything else, is provided only for familiarization purposes and is not financial advice or а recommendation. The whole text and its any part, as well as the charts cannot be considered as an offer to make a deal with any asset. IFC Markets and its employees under any circumstances are not liable for any action taken by someone else during or after reading the overview.
