- Analytics
- Technical Analysis
US Dollar Index Technical Analysis - US Dollar Index Trading: 2018-05-17
Positive data bullish for USDIDX
Continued rise in retail sales indicates US economy not slowing. Will the USDIDX continue advancing?
Recent US economic data were positive: retail sales rose 0.3% over month in April, in line with expectations. This was the second month retail sales rose after a weak start to year. And central bank policy makers express their support for continued monetary tightening. Dallas Fed President Robert Kaplan said he wasn’t concerned with the rise in Treasury yields as the yield on the 10-year Treasury note breached above 3%, while San Francisco Fed President John Williams said he supports the Fed’s target of three or four rate increases this year. Positive economic data indicating accelerating economy are supportive of further monetary tightening which is bullish for the dollar index.
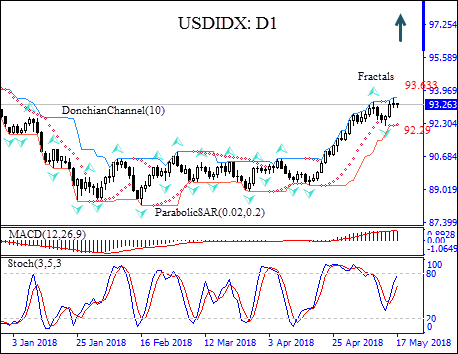
On the daily timeframe the USDIDX: D1 has been rising after hitting 41-month low in mid-February.
- The Parabolic indicator gives a buy signal.
- The Donchian channel indicates uptrend: it is tilted up.
- The MACD indicator gives a nuetral signal: it is above the signal line and the gap is steady.
- The Stochastic oscillator is rising but has not breached into the overbought zone.
We expect the bullish momentum will resume after the price breaches above the upper Donchian bound at 93.633. A price above that level can be used as an entry point for a pending order to buy. The stop loss can be placed below the lower Donchian bound at 92.29. After placing the pending order, the stop loss is to be moved to the next fractal low, following Parabolic signals. By doing so, we are changing the probable profit/loss ratio to the breakeven point. If the price meets the stop loss level (92.29) without reaching the order, we recommend canceling the order: the market sustains internal changes which were not taken into account.
Technical Analysis Summary
| Position | Buy |
| Buy stop | Above 93.633 |
| Stop loss | Below 92.29 |
- Get Certificate

Note:
This overview has an informative and tutorial character and is published for free. All the data, included in the overview, are received from public sources, recognized as more or less reliable. Moreover, there is no guarantee that the indicated information is full and precise. Overviews are not updated. The whole information in each overview, including opinion, indicators, charts and anything else, is provided only for familiarization purposes and is not financial advice or а recommendation. The whole text and its any part, as well as the charts cannot be considered as an offer to make a deal with any asset. IFC Markets and its employees under any circumstances are not liable for any action taken by someone else during or after reading the overview.
