- Analytics
- Technical Analysis
Gold vs Oil Technical Analysis - Gold vs Oil Trading: 2017-11-23
No change in XAUOIL downtrend
XAUOIL has been trading with negative bias as oil prices rallied recently. Will the XAUOIL continue falling?
The US Energy Information Agency reported on Wednesday the decline in US inventories was 1.9 million barrels last week, to below 2016 levels. Oil prices are rising supported also by expected extension of the crude oil output cut agreement beyond the 2018 March deadline at next OPEC meeting on November 30. And gold price is expected to decline as the Federal Reserve has signaled it plans to increase rates to a range of 1.25% to 1.5% at December 12-13 meeting. Thus the XAUOIL is expected to fall given bullish sentiment for oil and bearish prospect for gold.
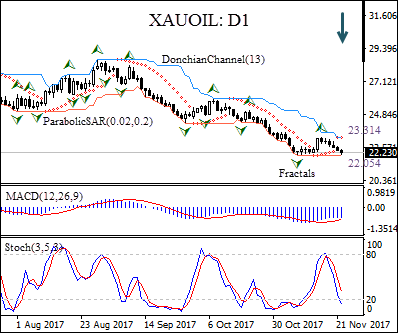
On the daily chart the XAUOIL: D1 has been retracing after rebounding to three-week high in mid-November.
- The Parabolic indicator gives a sell signal.
- The Donchian channel indicates no trend yet: it is flat.
- The stochastic oscillator has breached into the oversold zone: it is a bullish signal.
- The MACD indicator is below the signal line and the gap is rising which is also a bearish signal.
We expect the bearish momentum will continue after the price breaches below lower Donchian bound at 22.054. This level can be used as an entry point for a pending order to sell. The stop loss can be placed above the last fractal high at 23.314. After placing the pending order, the stop loss is to be moved to the next fractal high, following Parabolic signals. By doing so, we are changing the probable profit/loss ratio to the breakeven point. The most risk-averse traders may switch to the 4-hour chart after the trade and place there a stop-loss moving it in the direction of the trade. If the price meets the stop loss level (23.314) without reaching the order (22.054), we recommend canceling the order: the market sustains internal changes which were not taken into account.
Technical Analysis Summary
| Position | Sell |
| Sell stop | Below 22.054 |
| Stop loss | Above 23.314 |
- Get Certificate

Note:
This overview has an informative and tutorial character and is published for free. All the data, included in the overview, are received from public sources, recognized as more or less reliable. Moreover, there is no guarantee that the indicated information is full and precise. Overviews are not updated. The whole information in each overview, including opinion, indicators, charts and anything else, is provided only for familiarization purposes and is not financial advice or а recommendation. The whole text and its any part, as well as the charts cannot be considered as an offer to make a deal with any asset. IFC Markets and its employees under any circumstances are not liable for any action taken by someone else during or after reading the overview.
