- Análisis
- Análisis Técnico
Gas Natural Análisis Técnico - Gas Natural Trading: 2019-07-10
EIA raises US natural gas consumption forecast
The United States Energy Information Administration (EIA) raised its forecast for US natural gas consumption for 2019 and 2020. Will the NATGAS quotations growth continue ?
EIA published the Energy Overview (Short-Term Energy Overview) for July. Compared to the June overview, gas consumption in the United States is expected to increase by 0.42 billion cubic feet per day to 84.59 billion cubic meters in 2019 and by 0.16 billion cubic feet per day to 2020 to 84.54 billion. In other words, gas consumption should be reduced in the United States next year. It is difficult to say whether this is possible. This EIA forecast assumes the recovery of US natural gas reserves. For a long time (from September 2017) they are below their 5-year average. And in March of the current year they were one third lower than this average. Large-scale plans to increase the export of American liquefied natural gas (LNG) can help reduce reserves and increase quotes for ordinary natural gas. In this and next years, several large LNG terminals will be launched in the USA. Note that, according to U.S. The Commodity Futures Trading Commission for the past week, the number of positions for the sale of natural gas (net short) reached a maximum since November 2015, and the number of positions for purchase (net longs) has been at a minimum since December 2011. If speculators are forced to close short positions, the upward movement of gas quotations may receive an additional impetus.
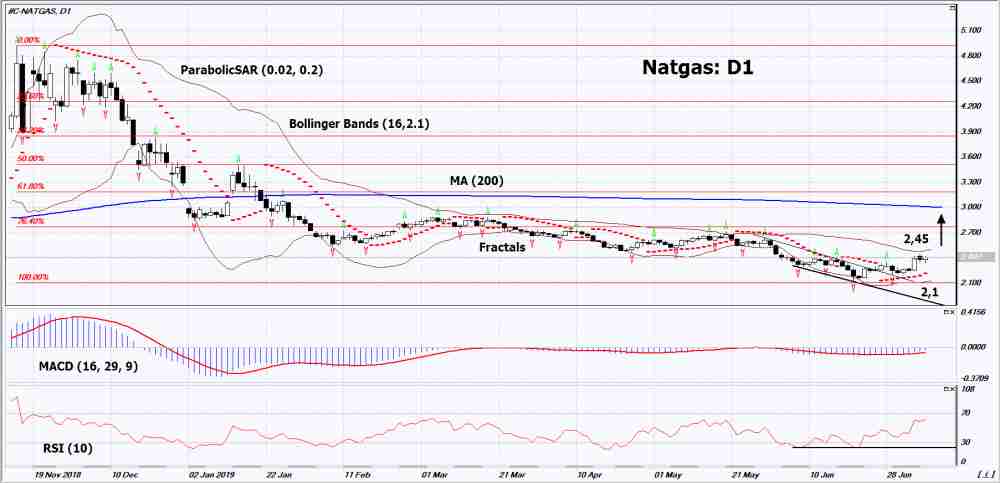
On a daily timeframe Natgas: D1 broke up the downtrend resistance line and adjusted upward. Various technical analysis indicators have generated an uptrend signals. Further growth of quotations is possible in case of an increase in demand in the USA and a massive closure of short positions.
- The Parabolic indicator shows a signal to increase.
- The Bolinger bands narrowed, indicating a volatility decrease. Both Bollinger lines are sloping up.
- the RSI indicator is above the 50 mark. It formed a weak divergence to increase.
- The MACD indicator gives bullish signal.
The bullish momentum may develop if Natgas exceeds its last maximum: 2.45. This level can be used as an entry point. The initial stop lose may be placed below the two last lower fractals, the bottom Bollinger line, the minimum since May 2016 and the Parabolic signal: 2.1. After opening the pending order stop shall be moved folowing the signals of Bollinger and Parabolic to the next fractal minimum.Thus, we are changing the potential profit/loss to the breakeven point. More risk-averse traders may switch to the 4-hour chart after the trade and place a stop loss moving it in the direction of the trade. If the price meets the stop level (2,1) without reaching the order (2,45), we recommend to cancel the order: the market sustains internal changes that were not taken into account.
Technical Analysis Summary
| Position | Buy |
| Buy stop | Above 2,45 |
| Stop loss | Below 2,1 |
- Obtener certificado

Nota:
Este resumen tiene carácter informativo-educativo y se publica de forma gratuita. Todos los datos que contiene este resumen, son obtenidos de fuentes públicas que se consideran más o menos fiables. Además, no hay niguna garantía de que la información sea completa y exacta. En el futuro, los resúmenes no se actualizarán. Toda la información en cada resumen, incluyendo las opiniones, indicadores, gráficos y todo lo demás, se proporciona sólo para la observación y no se considera como un consejo o una recomendación financiera. Todo el texto y cualquier parte suya, así como los gráficos no pueden considerarse como una oferta para realizar alguna transacción con cualquier activo. La compañía IFC Markets y sus empleados en cualquier circunstancia no son responsables de ninguna acción tomada por otra persona durante o después de la observación del resumen.
