- Analytics
- Technical Analysis
FMCG Stocks Technical Analysis - FMCG Stocks Trading: 2017-07-10
Investors expect a significant increase in companies' profits
In this review, we suggest considering the personal composite instrument (PCI) "Stock Index – Non-cyclical stocks". It reflects the price dynamics of 6 companies’ stocks traded on the US stock exchanges NASDAQ and NYSE. The PCI increases in case of their price growth. It has risen by 22% since December 2016. Will the Non-cyclical_Stocks price correct?
The base part of this personal composite instrument includes the stocks of McDonalds Corporation, PepsiCo Inc, Altria Group, Philip Morris International Inc, Procter & Gamble Company, Coca-Cola Company. The portfolio is quoted in USD. A possible negative factor for the stock market may be the plans of the US Fed to continue the interest rate hike policy. In this case, the companies’ debt burden may increase. Currently, the US FED FUNDS TARGET RATE is 1.25%. The next Fed meeting will be held on July 26, 2017. This Wednesday and Thursday, the head of the US regulator is expected to speak in the US Senate, and important inflation data for June will be released on Friday. The impressive growth of the Non-cyclical_Stocks index is due to the expectations of a significant growth in profits and revenues of the US companies. According to forecasts, the profits of the American high-tech companies increased by 11.2% in Q2 of 2017. Moreover, semiconductor manufacturers will demonstrate the best results. The profit of the companies included in the S&P 500 list is expected to grow by 7.9%. The revenue growth of the high-tech companies can amount to 7.2% and the rest - 4.6%. The quarterly reports will be published this week. If they disappoint investors, then the correction is possible.
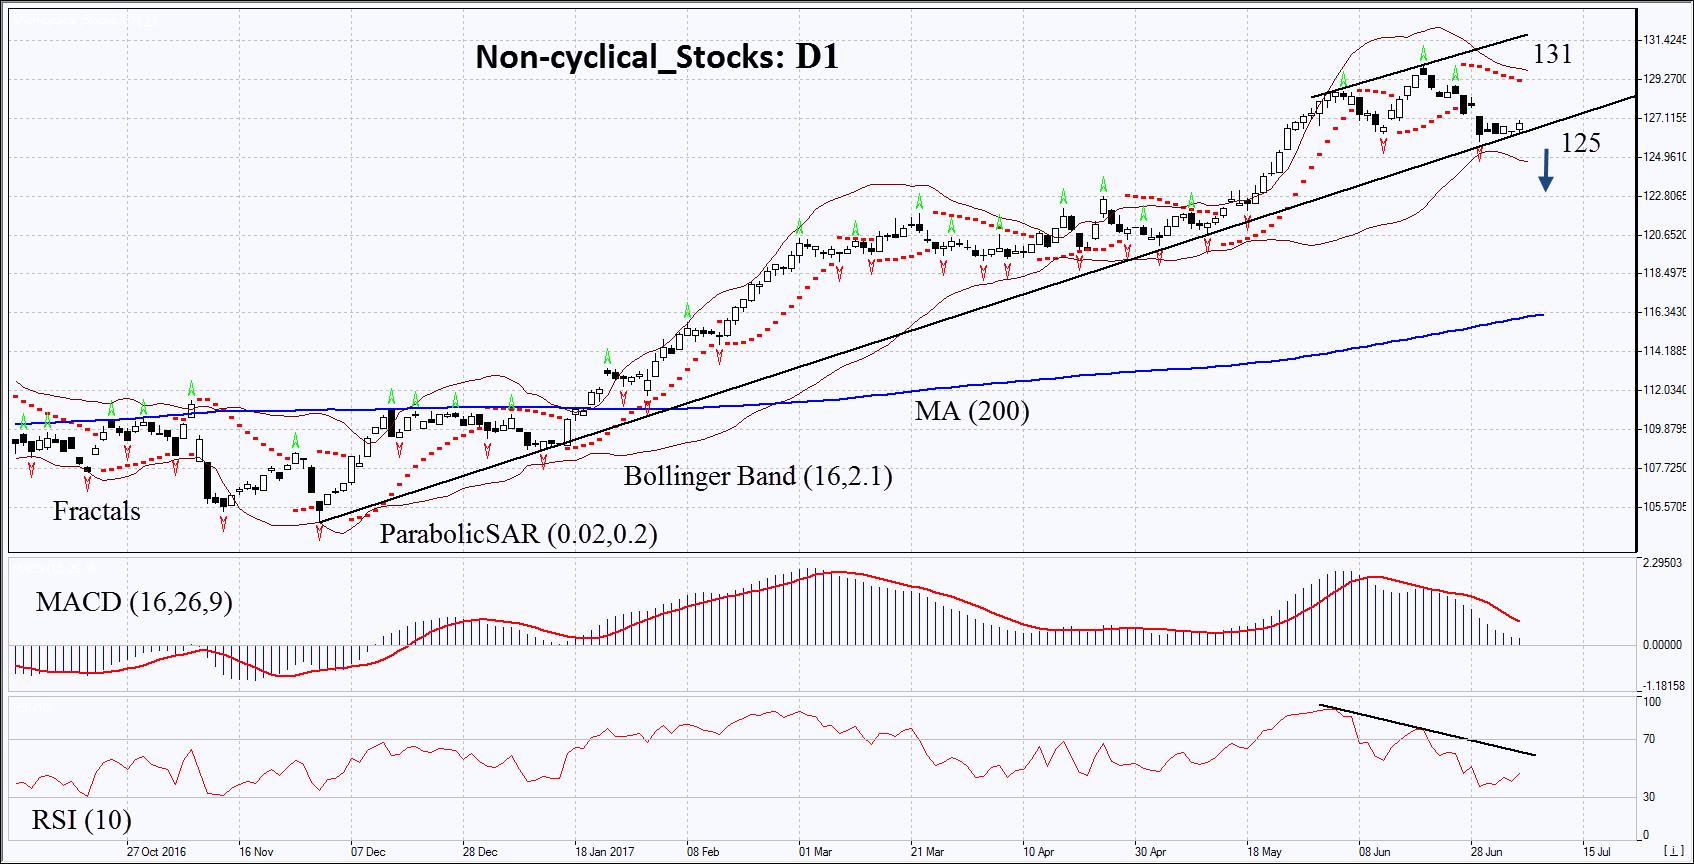
On the daily timeframe, Non-cyclical_Stocks: D1 continues to be within the rising trend, but its growth has slowed down. A downward correction is possible in case of the worsening of the US macroeconomic indicators and negative corporate reports for Q2.
- The Parabolic indicator gives a bearish signal.
- The Bollinger bands have narrowed, which means lower volatility. They are tilted downward.
- The RSI indicator is below 50. It has formed a negative divergence.
- The MACD indicator gives a bearish signal.
The bearish momentum may develop in case Non-cyclical_Stocks falls below the last fractal low and the support line of the uptrend at 125. This level may serve as an entry point. The initial stop loss may be placed above the two last fractal highs, the Parabolic signal, the upper Bollinger band and the historic high at 131. After opening the pending order, we shall move the stop to the next fractal high following the Bollinger and Parabolic signals. Thus, we are changing the potential profit/loss to the breakeven point. More risk-averse traders may switch to the 4-hour chart after the trade and place there a stop loss moving it in the direction of the trade. If the price meets the stop level at 131 without reaching the order at 125 we recommend cancelling the position: the market sustains internal changes that were not taken into account.
Technical Analysis Summary
| Position | Sell |
| Sell stop | Below 125 |
| Stop loss | Above 131 |
- Get Certificate

Note:
This overview has an informative and tutorial character and is published for free. All the data, included in the overview, are received from public sources, recognized as more or less reliable. Moreover, there is no guarantee that the indicated information is full and precise. Overviews are not updated. The whole information in each overview, including opinion, indicators, charts and anything else, is provided only for familiarization purposes and is not financial advice or а recommendation. The whole text and its any part, as well as the charts cannot be considered as an offer to make a deal with any asset. IFC Markets and its employees under any circumstances are not liable for any action taken by someone else during or after reading the overview.
