- Analytics
- Technical Analysis
NZD USD Technical Analysis - NZD USD Trading: 2017-07-12
Preparing for the publication of macroeconomic statistics
The New Zealand dollar weakened on the background of continuing earthquakes in the Pacific Ocean, near the shores of New Zealand. Macroeconomic data may be additional negative factor. Will the NZDUSD continue to decline?
Retail sales with the usage of credit cards in New Zealand did not change in June 2017, compared to May. Most market participants expected them to grow by 0.8% after the decrease by 0.4% in May compared with April. On July 12-13, 2017 from evening to early morning, home sales data, food price index for June and the consumer confidence index for July will be published in New Zealand. On July 14, the New Zealand Manufacturing PMI and on July 18 the inflation data will be released. Preliminary forecasts of macroeconomic statistics support the preservation of the current rate of the Reserve Bank of New Zealand at 1.75% and may have a negative impact on the local currency exchange rate.
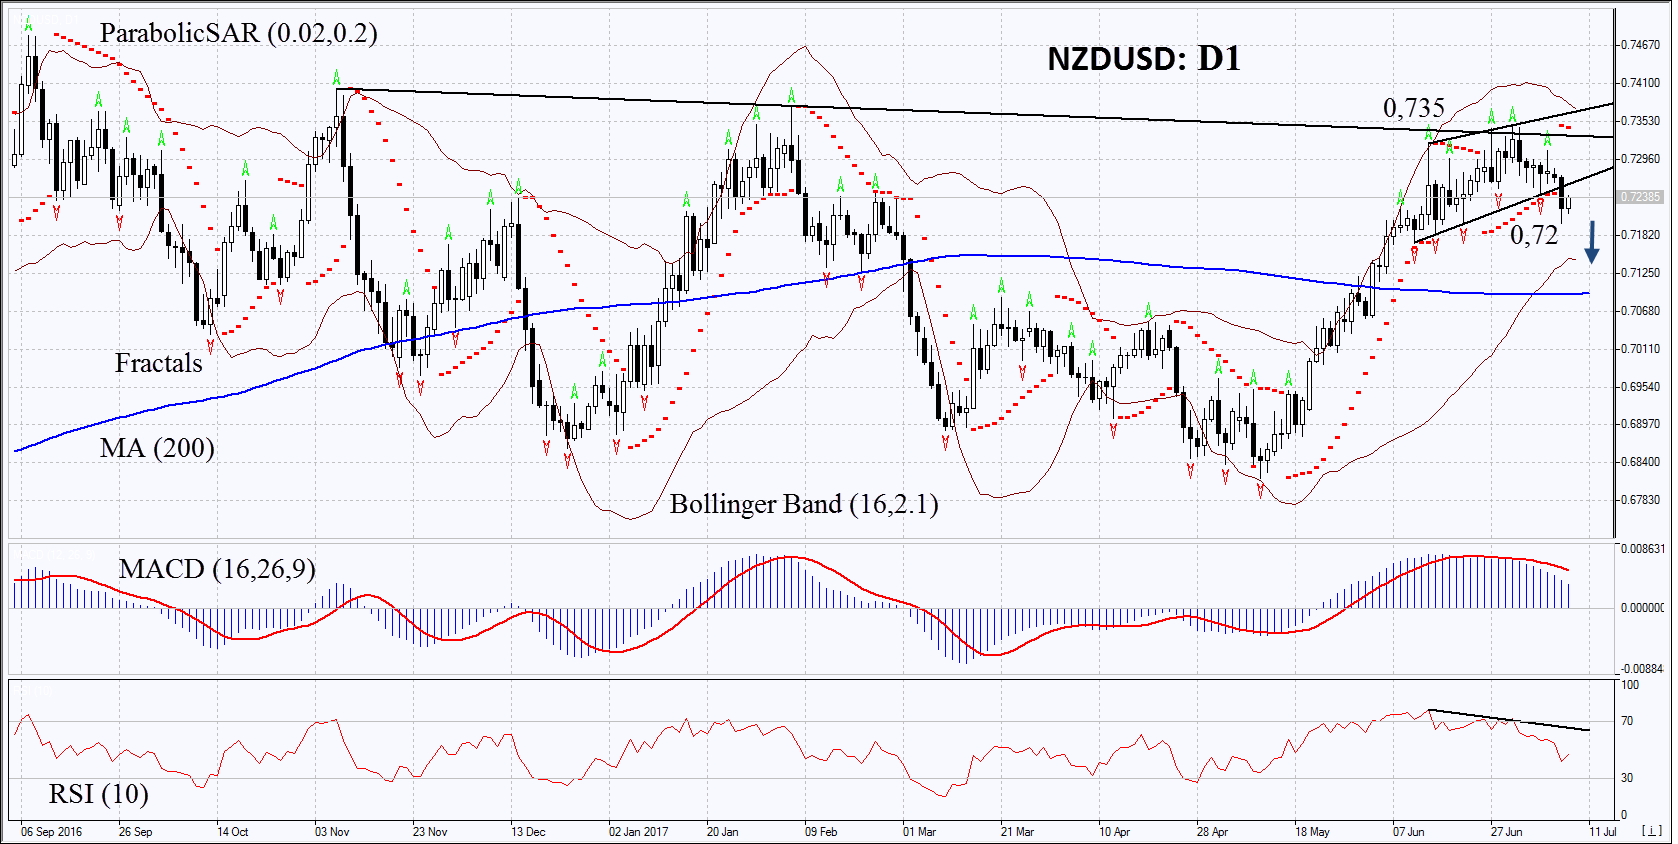
On the daily timeframe, NZDUSD: D1 falls from the rising price channel. Downward correction is possible in case of the publication of negative macroeconomic statistics in New Zealand and the strengthening of the US dollar.
- The Parabolic indicator gives a bearish signal.
- The Bollinger bands have widened, which means lower volatility. They are tilted downwards.
- The RSI is below 50. It has formed a negative divergence.
- The MACD gives a bearish signal.
The bearish momentum may develop in case NZDUSD drops below the last low. It was fixed on the day of the earthquake at 0.72. This level may serve as the entry point. The initial stop loss may be placed above the two last fractal highs, the Parabolic signal and the 5-month high at 0.735. After opening the pending order, we shall move the stop to the next fractal high following the Bollinger and Parabolic signals. Thus, we are changing the potential profit/loss to the breakeven point. More risk-averse traders may switch to the 4-hour chart after the trade and place there a stop loss moving it in the direction of the trade. If the price meets the stop level at 0.735 without reaching the order at 0.72 we recommend cancelling the position: the market sustains internal changes that were not taken into account.
Summary of technical analysis
| Position | Sell |
| Sell stop | below 0,72 |
| Stop loss | above 0,735 |
- Get Certificate

Note:
This overview has an informative and tutorial character and is published for free. All the data, included in the overview, are received from public sources, recognized as more or less reliable. Moreover, there is no guarantee that the indicated information is full and precise. Overviews are not updated. The whole information in each overview, including opinion, indicators, charts and anything else, is provided only for familiarization purposes and is not financial advice or а recommendation. The whole text and its any part, as well as the charts cannot be considered as an offer to make a deal with any asset. IFC Markets and its employees under any circumstances are not liable for any action taken by someone else during or after reading the overview.
