- Analytics
- Technical Analysis
S&P 500 Technical Analysis - S&P 500 Trading: 2017-04-17
US warships reached the Korean Peninsula
On Friday, the US stock exchanges did not work due to the Easter holiday. On Thursday, the US stock indices dropped on the background of the escalated political situation in the South-East Asia. Will the S&P 500 decline?
Market participants are concerned that North Korea may conduct next nuclear weapon tests on Saturday, April 15, 2017, in honor of the 105th birth anniversary of Kim Il Sung. The strike group of the US Navy as a part of the nuclear-powered aircraft carrier Carl Vinson, the guided-missile cruiser USS Lake Champlain and destroyers arrived at the shores of the Korean Peninsula. Previously, the US reported that it might launch a pre-emptive strike against North Korea in case of nuclear tests. An additional negative for the S&P 500 may be the reduction of US banks’ profits from mortgage lending according to the results of Q1, 2017. Since the beginning of the year, the S&P 500 banks dropped by 3.2%, while the overall S&P 500 rose by 4%. On Friday, weak economic data were published in the US. Retail sales, decreased for the 2nd month in a row in March, 2017. Inflation rate dropped, which may slightly decrease the Fed’s willingness to raise the rate as soon as possible.
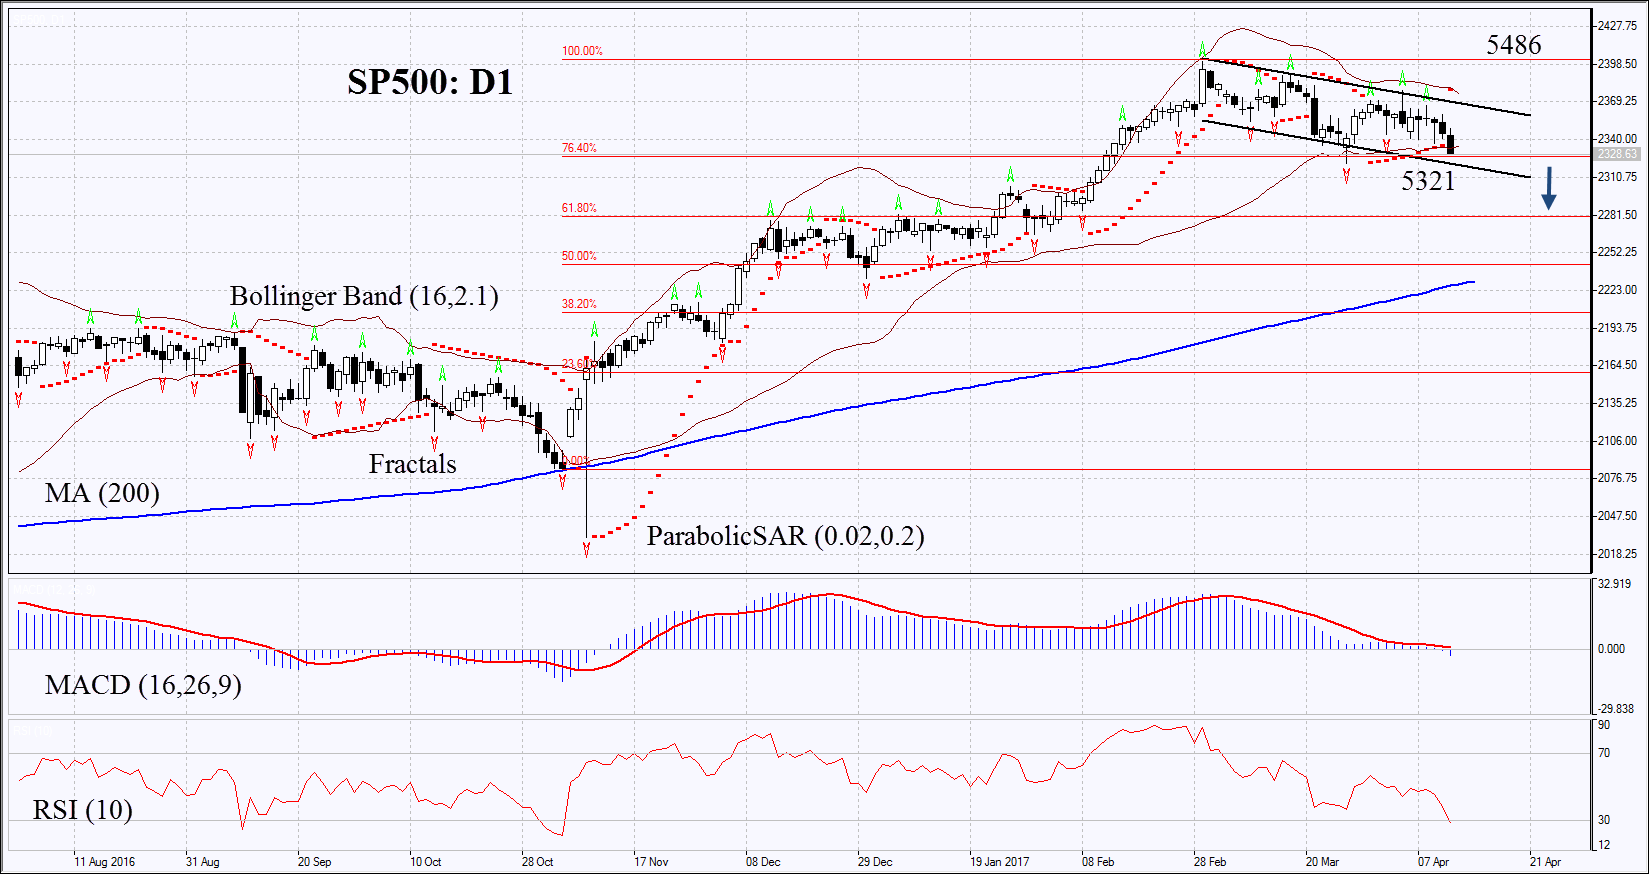
On the daily timeframe, SP500: D1 has approached the bottom line of the descending channel and the 1st line of Fibonacci Fan. In order to open a sell position, a downward movement has to accelerate at first. The further decrease of the index is possible in case of the escalated political situation around North Korea, as well as in case of the publication of weak economic data and corporate earnings in the US.
- Parabolic indicator gives bearish signals.
- The Bollinger bands have markedly narrowed, which means very low volatility.
- The RSI reached the oversold zone. No divergence.
- The MACD gives bearish signals.
The bearish momentum may develop in case SP500 drops below the two last fractal lows, the 1st line of Fibonacci Fan and the lower Bollinger band at 5321. This level may serve as the entry point. The initial stop-loss may be placed above the historic high at 5486. After opening the pending order, we shall move the stop to the next fractal high following the Bollinger and Parabolic signals. Thus, we are changing the potential profit/loss to the breakeven point. More risk-averse traders may switch to the 4-hour chart after the trade and place there a stop-loss moving it in the direction of the trade. If the price meets the stop level at 5486 without reaching the order at 5321 we recommend cancelling the position: the market sustains internal changes that were not taken into account.
Summary of technical analysis
| Position | Sell |
| Sell stop | below 5321 |
| Stop loss | above 5486 |
- Get Certificate

Note:
This overview has an informative and tutorial character and is published for free. All the data, included in the overview, are received from public sources, recognized as more or less reliable. Moreover, there is no guarantee that the indicated information is full and precise. Overviews are not updated. The whole information in each overview, including opinion, indicators, charts and anything else, is provided only for familiarization purposes and is not financial advice or а recommendation. The whole text and its any part, as well as the charts cannot be considered as an offer to make a deal with any asset. IFC Markets and its employees under any circumstances are not liable for any action taken by someone else during or after reading the overview.
