- Analytics
- Technical Analysis
USD CHF Technical Analysis - USD CHF Trading: 2017-07-14
Fed policy tightening bearish for Swiss franc
Swiss central bank is expected to maintain expansionary policy stance with data indicating falling household spending and disinflation. Will the Swiss franc continue falling?
The Swiss GDP grew 0.3% in first quarter, slower than expected. The Swiss National Bank decided to keep the target range for the three-month Libor at between minus 1.25% and minus 0.25% at its 15 June meeting. The central bank considers the franc significantly overvalued and is expected to maintain expansionary policy stance. Recent Manufacturing PMI data confirmed improvement in manufacturing sector in the second quarter. However contracting retail sales in April and May indicate subdued household spending, confirmed also by fall into negative territory of June consumer price inflation. While the central bank projects the economic recovery will continue, low growth rates and consumer price disinflation are not bullish for the Swiss franc. Against this background Federal Reserve’s policy course to tighten money supply provides additional support to US dollar against the Swiss franc.
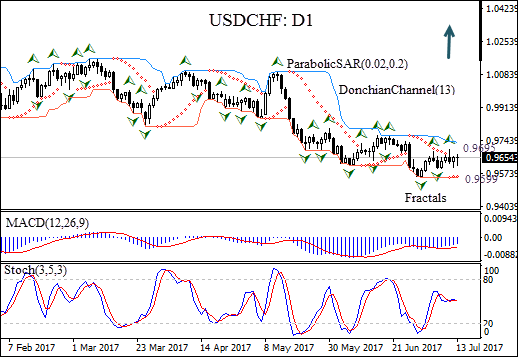
The USDCHF is rising on the daily chart after hitting seven month low two weeks ago.
- The Parabolic indicator gives a buy signal.
- The Donchian channel signals no trend has formed yet: the channel is flat.
- The MACD indicator is below the signal line and the gap is falling, which is a bullish signal.
- The stochastic oscillator is falling, but hasn’t reached the oversold zone.
We believe the bullish momentum will continue after the price breaches above the last fractal high at 0.9695. This level can be used as an entry point for a pending order to buy. The stop loss can be placed below the fractal low at 0.9599. After placing the order, the stop loss is to be moved every day to the next fractal low, following Parabolic signals. Thus, we are changing the probable profit/loss ratio to the breakeven point. If the price meets the stop loss level without reaching the order, we recommend cancelling the position: the market sustains internal changes which were not taken into account.
Technical Analysis Summary
| Position | Buy |
| Buy stop | Above 0.9695 |
| Stop loss | Below 0.9599 |
- Get Certificate

Note:
This overview has an informative and tutorial character and is published for free. All the data, included in the overview, are received from public sources, recognized as more or less reliable. Moreover, there is no guarantee that the indicated information is full and precise. Overviews are not updated. The whole information in each overview, including opinion, indicators, charts and anything else, is provided only for familiarization purposes and is not financial advice or а recommendation. The whole text and its any part, as well as the charts cannot be considered as an offer to make a deal with any asset. IFC Markets and its employees under any circumstances are not liable for any action taken by someone else during or after reading the overview.
