- Analisi
- Analisi Tecnica
Natural Gas vs Oil Analisi Tecnica - Natural Gas vs Oil Trading: 2019-08-13
USA increases LNG export
In this review, we suggest to consider a personal composite instrument (PCI) & GAS / OIL. It reflects the dynamics of changes in the cost of American natural gas relative to American West Texas Intermediate (WTI) light oil. Will the GAS/OIL quotations increase?
Their increase means that natural gas is in higher demand than oil. According to the International Energy Agency (IEA), global oil demand in May 2019 decreased by 160 thousand barrels per day (bvd) compared to May 2018. From January to May this year, it grew by 520 thousand BVD, which was the minimum increase since the crisis of 2008. The IEA lowered its forecast for global oil consumption growth in 2019/20 to 1.1 and 1.3 million bwd and noted that the main increase will be concentrated in China, the USA and India. At the same time, the IEA expects an increase in OPEC oil production by 2.2 million bwd in 2020. The trade war between China and the United States can slow down the global economy and oil demand. We note the publication of weak macroeconomic data in European countries. UK GDP growth in the 2nd quarter of this year was worse than forecast and amounted to 1.2% in annual terms. Germany's foreign trade surplus and its industrial production in June were also worse than expected. In turn, spot prices for natural gas in the US at the Henry Hub terminal in Louisiana are now near a 20-year low. Market participants do not exclude their upward correction against the background of an increase in the export of American liquefied natural gas (LNG) from 3 billion cubic feet per day in 2018 to 6.9 billion in 2020.
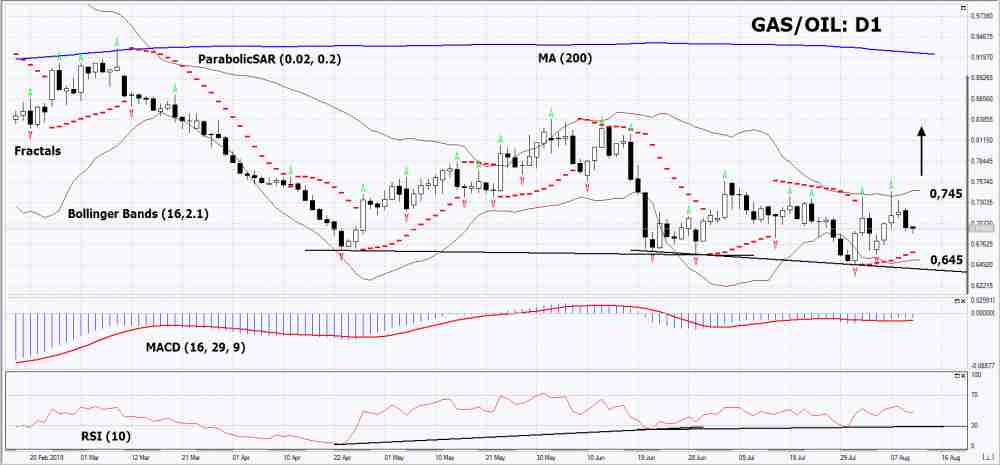
On the daily timeframe GAS/OIL: D1 is in a neutral trend. Most of technical analysis indicators have generated uptrend signals. Further growth is possible in the event of a decrease in global oil demand, an increase in US LNG exports.
- The Parabolic indicator demonstrates uptrend signal.
- The Bolinger bandsnarrowed, indicating a volatility decrease. Both Bollinger Lines Tilt Up.
- The RSI indicator is below the 50 mark. It has formed a divergence to increase.
- The MACD indicator gives a bullish signal.
The bullish momentum may develop if GAS/OIL exeeds the upper Bollinger band and its last upper fractal: 0.745. This level can be used as an entry point. Initial stop lose may be placed below the last two lower fractals, the minimum since November 2013 and the Parabolic signal: 0.645. After the opening of the pending order, the stop shall be moved following the signals of Bollinger and Parabolic to the next fractal minimum.Thus, we are changing the potential profit/loss to the breakeven point. More risk-averse traders may switch to the 4-hour chart after the trade and place a stop loss moving it in the direction of the trade. If the price meets the stop level (0,645) without reaching the order (0,745), we recommend to cancel the order: the market sustains internal changes that were not taken into account.
Technical Analysis Summary
| Position | Buy |
| Buy stop | Above 0,745 |
| Stop loss | Below 0,645 |
- Ottieni certificato

Note:
Questa panormaica è di carattere informativo-educativo e viene pubblicata gratuitamente. Tutti i dati compresi nella panoramica sono ottenuti da fonti pubbliche conosciute più o meno affidabili. Inoltre non c'è alcuna garanzia che le informazioni fornite siano precise e complete. Le panoramiche non vengono aggiornate. Tutta l'informazione in ciascuna panoramica, compresi indicatori, opinioni, grafici e o quant'altro, è fornita a scopo conoscitivo e non è un consiglio finanziario. Tutto il testo e qualsiasi delle sue parti, e anche i grafici non possono essere considerati un'offerta per effettuare un'operazione con un qualsiasi asset. IFC Markets e i suoi impiegati in alcun caso non sono responsabili per qualsiasi azione intrapresa sulla base delle informazioni contenute.
