- Analisi
- Analisi Tecnica
USD JPY Analisi Tecnica - USD JPY Trading: 2019-08-14
US may negotiate foreign trade with China
The U.S. postponed the introduction of new import duties on Chinese goods until December 15, 2019. Within two weeks, additional negotiations will be held on mutual trade. Will the USDJPY quotations grow?
Earlier, the United States was going to introduce a 10% duty on imports of Chinese goods worth $ 300 billion a year from September 1, 2019. Now this question has been postponed to December. By the end of August, the parties will conduct telephone calls. Investors regarded this message as a real opportunity to mitigate the US-China foreign trade conflict. This weakened the Japanese yen, which was previously seen as a safe haven currency and appreciably strengthened. Earlier, Deputy Minister of Finance for International Affairs Yoshiki Takeuchi said that his department and the Central Bank of Japan could take measures to prevent the yen from becoming too strong. A regular meeting of the Bank of Japan will be held on September 19, 2019, at which additional statements can be made to weaken the yen. On August 14, data on industrial orders will be released in Japan, and on August 15, industrial production for June. They can affect the dynamics of the yen.
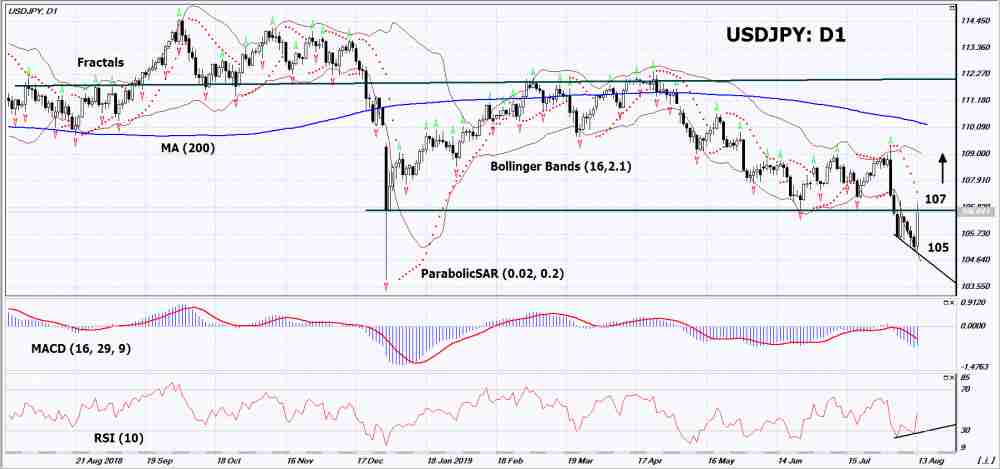
On the daily timeframe USDJPY: D1 trying to return to the previous wide neutral range. Various technical analysis indicators have generated uptrend signals. Further growth of quotations is possible if negative macroeconomic data are published in Japan and positive in the USA, as well as normalization of US-Chinese foreign trade relations.
- The Parabolic indicator demonstrates a downtrend signal. It can be considered as an additional resistance level that must be overcome to open a buy position.
- The Bolinger bands greatly expanded, indicating high volatility.
- The RSI indicator is below the 50 mark. It has formed a divergence to increase.
- The MACD indicator demonstrates a downtrend signal.
The bullish momentum may develop if USDJPY exceeds its last maximum and the Parabolic signal: 107. This level can be used as an entry point. The initial stop lose may be placed below the last minimum: 105. After opening a pending order, stop shall be moved following the Bollinger and Parabolic signals to the next fractal minimum. Thus, we are changing the potential profit/loss to the breakeven point. More risk-averse traders may switch to the 4-hour chart after the trade and place a stop loss moving it in the direction of the trade. If the price meets the stop level (105) without reaching the order (107), we recommend to cancel the order: the market sustains internal changes that were not taken into account.
Technical Analysis Summary
| Position | Buy |
| Buy stop | Above 107 |
| Stop loss | Below 105 |
- Ottieni certificato

Note:
Questa panormaica è di carattere informativo-educativo e viene pubblicata gratuitamente. Tutti i dati compresi nella panoramica sono ottenuti da fonti pubbliche conosciute più o meno affidabili. Inoltre non c'è alcuna garanzia che le informazioni fornite siano precise e complete. Le panoramiche non vengono aggiornate. Tutta l'informazione in ciascuna panoramica, compresi indicatori, opinioni, grafici e o quant'altro, è fornita a scopo conoscitivo e non è un consiglio finanziario. Tutto il testo e qualsiasi delle sue parti, e anche i grafici non possono essere considerati un'offerta per effettuare un'operazione con un qualsiasi asset. IFC Markets e i suoi impiegati in alcun caso non sono responsabili per qualsiasi azione intrapresa sulla base delle informazioni contenute.
