- Analisi
- Analisi Tecnica
USD/PLN Analisi Tecnica - USD/PLN Trading: 2019-11-06
Getting ready for a meeting of the Central Bank of Poland
The next meeting of the National Bank of Poland will be held on November 6, 2019. Will the USDPLN quotations continue growing?
The upward movement indicates weakening of the Polish zloty against the US dollar. It is expected that the National Bank of Poland will keep the rate at the current level of 1.5%, at which it has been since 2015. However, theoretically, the National Bank may announce any plans for easing monetary policy in the future. In October, the Polish PMI indicator of business activity in the industry fell to a minimum in 10 years and amounted to 45.6 points. Its decline has been observed for 12 consecutive months. It should be noted that on November 13 the balance of the current account for September will be published in Poland, and on November 14 - the GDP for the 3rd quarter. These data may also affect the dynamics of the zloty.
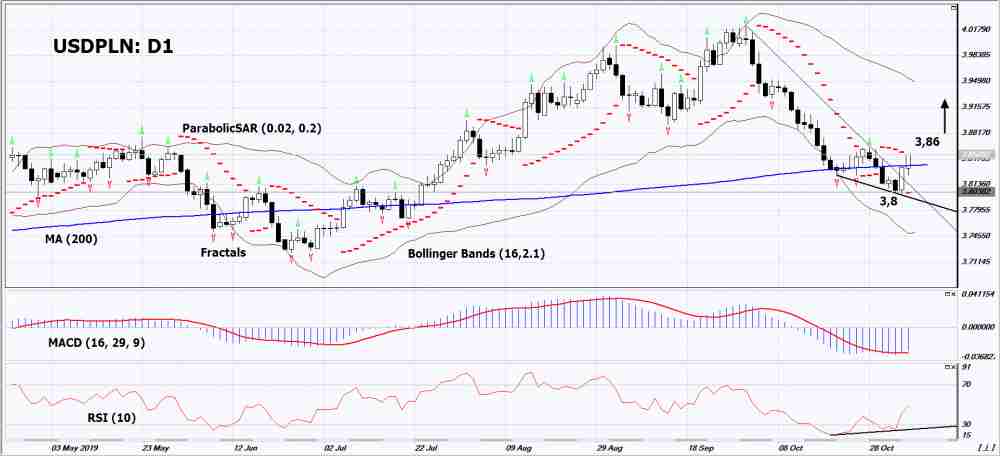
On the daily timeframe USDPLN: D1 broken up the resistance line of the falling trend. Now it is growing as part of the correction. Various technical analysis indicators have generated signals to increase. Further growth of quotations is possible if the monetary policy of the Polish National Bank is relaxed.
- The Parabolic indicator gives an uptrend signal.
- The Bolinger bands widened, indicating high volatility. The bottom line of the Bollinger has a slope up.
- The RSI indicator is below the 50 mark. It has formed a divergence to increase.
- The MACD indicator gives a bullish signal.
The bullish momentum may develop if USDPLN exceeds the last upper fractal: 3.86. This level can be used as an entry point. The initial stop lose may be placed below the Parabolic signal: 3.8. After the opening of the pending order, the stop shall be moved following the Bollinger and Parabolic signals to the next fractal minimum. Thus, we are changing the potential profit/loss to the breakeven point. More risk-averse traders may switch to the 4-hour chart after the trade and place a stop loss moving it in the direction of the trade. If the price meets the stop level (3,8) without reaching the order (3,86), we recommend to cancel the order: the market sustains internal changes that were not taken into account.
Technical Analysis Summary
| Position | Buy |
| Buy stop | Above 3,86 |
| Stop loss | Below 3,8 |
- Ottieni certificato

Note:
Questa panormaica è di carattere informativo-educativo e viene pubblicata gratuitamente. Tutti i dati compresi nella panoramica sono ottenuti da fonti pubbliche conosciute più o meno affidabili. Inoltre non c'è alcuna garanzia che le informazioni fornite siano precise e complete. Le panoramiche non vengono aggiornate. Tutta l'informazione in ciascuna panoramica, compresi indicatori, opinioni, grafici e o quant'altro, è fornita a scopo conoscitivo e non è un consiglio finanziario. Tutto il testo e qualsiasi delle sue parti, e anche i grafici non possono essere considerati un'offerta per effettuare un'operazione con un qualsiasi asset. IFC Markets e i suoi impiegati in alcun caso non sono responsabili per qualsiasi azione intrapresa sulla base delle informazioni contenute.
