- マーケット分析
- テクニカル分析
オーストラリア200種株価指数 テクニカル分析 - オーストラリア200種株価指数 取引:2019-07-05
Improving trade surplus bullish for AU200
Trade surplus and retail sales rose in Australia. Will the AU200 stock index continue advancing?
Recent economic data from Australia were positive: Australia's retail sales rose in May and trade surplus hit record high. Retail sales rose by 0.1% in May after 0.1% decline in April, driven by stronger spending in restaurants and on household goods. Australia's trade surplus rose to a record A$5.745 billion in May following A$4.820 billion surplus in April, as exports rose by 4%, while imports rose by 1%. The increasing export was supported by rising prices for commodities as well as weaken currency as the Reserve Bank of Australia lowered interest rates. The Reserve Bank of Australia cut interest rates for the second time in as many months on Tuesday to 1.00%, down from 1.25%, adding to a cut in June. Rising trade surplus and consumer sentiment is bullish for Australia’s stock market index.
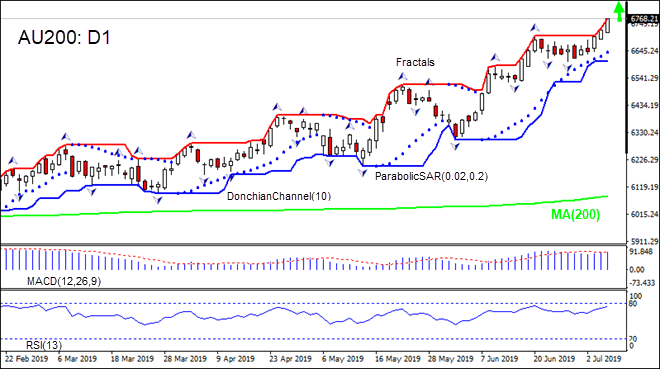
On the daily timeframe AU200: D1 is gaining after hitting seven-month low in the end of February.
- The Donchian channel indicates an uptrend: it is widening upward.
- The Parabolic indicator has formed a buy signal.
- The MACD indicator is above the signal line and the gap is widening, which is a bullish signal.
- The RSI oscillator is rising and is reaching the overbought zone.
We believe the bullish momentum will continue after the price closes above the upper boundary of Donchian channel at 6768.61. This level can be used as an entry point for placing a pending order to buy. The stop loss can be placed below the lower Donchian boundary at 6605.31. After placing the order, the stop loss is to be moved every day to the next fractal low, following Parabolic signals. Thus, we are changing the expected profit/loss ratio to the breakeven point. If the price meets the stop loss level (6605.31) without reaching the order (6768.61), we recommend cancelling the order: the market has undergone internal changes which were not taken into account.
Technical Analysis Summary
| Position | Buy |
| Buy stop | Above 6768.61 |
| Stop loss | Below 6605.31 |
- コースを取って、

【重要な注意事項】:
本レポートは、当社の親会社であるアイエフシーマーケットが作成したものの邦訳です。本レポートには、当社のサービスと商品についての情報を含みますが、お客様の投資目的、財務状況、資金力にかかわらず、情報の提供のみを目的とするものであり、金融商品の勧誘、取引の推奨、売買の提案等を意図したものではありません。 本レポートは、アイエフシーマーケットが信頼できると思われる情報にもとづき作成したものですが、次の点に十分ご留意ください。アイエフシーマーケットおよび当社は、本レポートが提供する情報、分析、予測、取引戦略等の正確性、確実性、完全性、安全性等について一切の保証をしません。アイエフシーマーケットおよび当社は、本レポートを参考にした投資行動が利益を生んだり損失を回避したりすることを保証または約束あるいは言外に暗示するものではありません。アイエフシーマーケットおよび当社は、本レポートに含まれる不確実性、不正確性、不完全性、誤謬、文章上の誤り等に起因して、お客様または第三者が損害(直接的か間接的かを問いません。)を被った場合でも、一切の責任を負いません。
