- マーケット分析
- テクニカル分析
オイル対ユーロ テクニカル分析 - オイル対ユーロ 取引:2017-03-29
OPEC may extend limits on oil production
In this report we consider studying the personal composite instrument (PCI) BRENT to euro. It reflects the Brent oil dynamics to euro. PCI may rise in case of higher oil prices while euro will lose positions to the US dollar.
Oil advanced on Tuesday more than 2% in global market. The militant groups blocked the Sharara and Wafa oil fields in Western part of Libya. This made national oil production fall by about one third or by 252 thousand barrels per day (bpd). The additional negative factor for prices was the speech by Iran, Russia and Azerbaijan representatives on reasonability of oil production cuts by OPEC and other oil producers in the 2nd half of the current year. In December 2016 OPEC members agreed to cut oil production by 1.8mln barrels a day. The main negative factor for Brent may be the next increase in oil reserves in the US. The official data will come out on Wednesday. The stocks are expected to increase 1.2mln barrels. They are currently being at the historical high of 533,1mln barrels. The euro fell against the US dollar on Tuesday as the Chicago and Dallas Fed presidents said the further Fed rate hike is essential. The ECB Governing Council member Jan Smets said, in his turn, that the proponents of monetary tightening are outnumbered yet. Any announcements on the prospects of the ECB rate hike are expected no earlier than its next meeting on April 27, 2017 takes place.
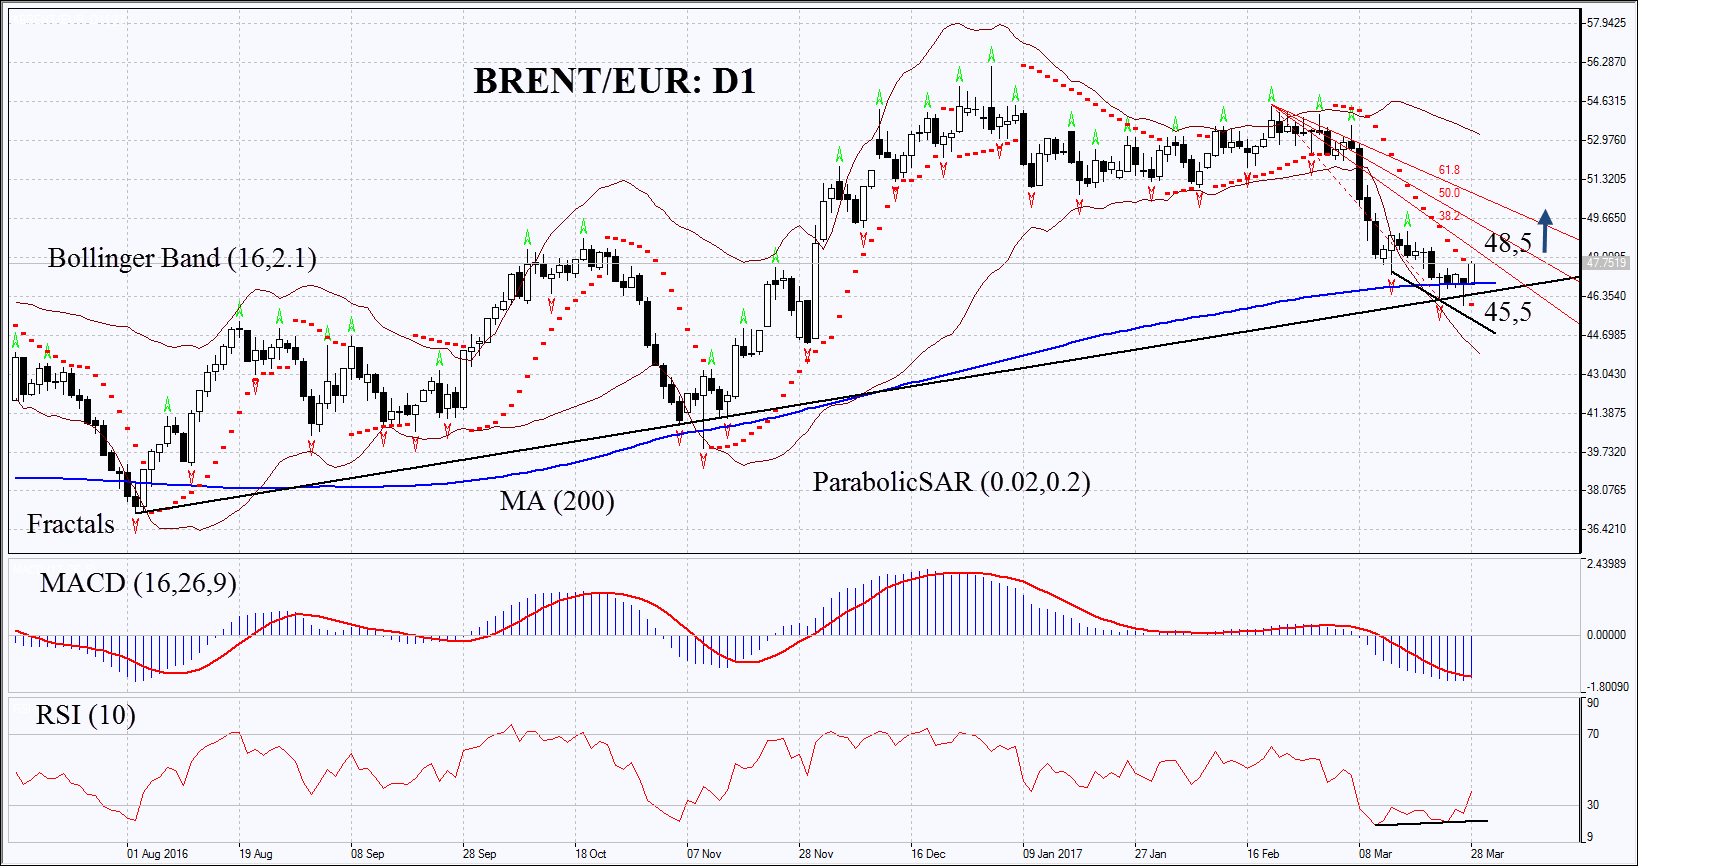
On the daily chart BRENT/EUR : D1 failed to break down through the 200-day moving average serving the support line. It is struggling to correct up. The further increase is probable in case of negative news from Europe and weaker euro as well as in case of higher global oil prices.
- The Parabolic indicator gives bullish signals.
- The Bollinger bands have widened which means higher volatility.
- The RSI is below 50. It has formed positive divergence.
- The MACD gives bullish signals.
The bullish momentum may develop in case BRENT/EUR surpasses the 1st Fibonacci Fan at 48.5. This level may serve the point of entry. The initial stop-loss may be placed below the last fractal low, the 200-day moving average and the Parabolic signal at 45.5. Having opened the pending order we shall move the stop to the next fractal low following the Parabolic and Bollinger signals. Thus, we are changing the probable profit/loss ratio to the breakeven point. The most risk-averse traders may switch to the 4-hour chart after the trade and place there a stop-loss moving it in the direction of the trade. If the price meets the stop-loss level at 45.5 without reaching the order at 48.5, we recommend cancelling the position: the market sustains internal changes which were not taken into account.
Summary of technical analysis
| Position | Buy |
| Buy stop | above 48.5 |
| Stop loss | below 45.5 |
- コースを取って、

【重要な注意事項】:
本レポートは、当社の親会社であるアイエフシーマーケットが作成したものの邦訳です。本レポートには、当社のサービスと商品についての情報を含みますが、お客様の投資目的、財務状況、資金力にかかわらず、情報の提供のみを目的とするものであり、金融商品の勧誘、取引の推奨、売買の提案等を意図したものではありません。 本レポートは、アイエフシーマーケットが信頼できると思われる情報にもとづき作成したものですが、次の点に十分ご留意ください。アイエフシーマーケットおよび当社は、本レポートが提供する情報、分析、予測、取引戦略等の正確性、確実性、完全性、安全性等について一切の保証をしません。アイエフシーマーケットおよび当社は、本レポートを参考にした投資行動が利益を生んだり損失を回避したりすることを保証または約束あるいは言外に暗示するものではありません。アイエフシーマーケットおよび当社は、本レポートに含まれる不確実性、不正確性、不完全性、誤謬、文章上の誤り等に起因して、お客様または第三者が損害(直接的か間接的かを問いません。)を被った場合でも、一切の責任を負いません。
