- マーケット分析
- テクニカル分析
Brent オイル テクニカル分析 - Brent オイル 取引:2019-01-07
OPEC + Decision on Cutting Production Entered into Force
The decision of OPEC and independent producers to reduce oil production came into force. Will it lead to Brent quotes growth?
Under the OPEC + agreement, the total reduction in oil production should be 1.2 million barrels per day. Of these, the OPEC share is 800 thousand barrels per day, and another 400 thousand must be provided by independent producers. In December, the production of the cartel has already decreased to 460 thousand barrels per day. Mainly due to this, last week, commercial oil reserves in the United States decreased by 4.5 million barrels. This numbers were announced by the independent American Petroleum Institute. According to official information from the Energy Information Administration, oil reserves in the US have grown. The next weekly records, that will be released on Wednesday, can significantly affect the dynamics of oil quotations. Another important influencing factor may be the outcome of the US-China trade negotiations, that will be held during January 7-8, 2019 in Beijing. The reduction of the intensity in mutual trade war can revive the global economy and increase the demand for oil.
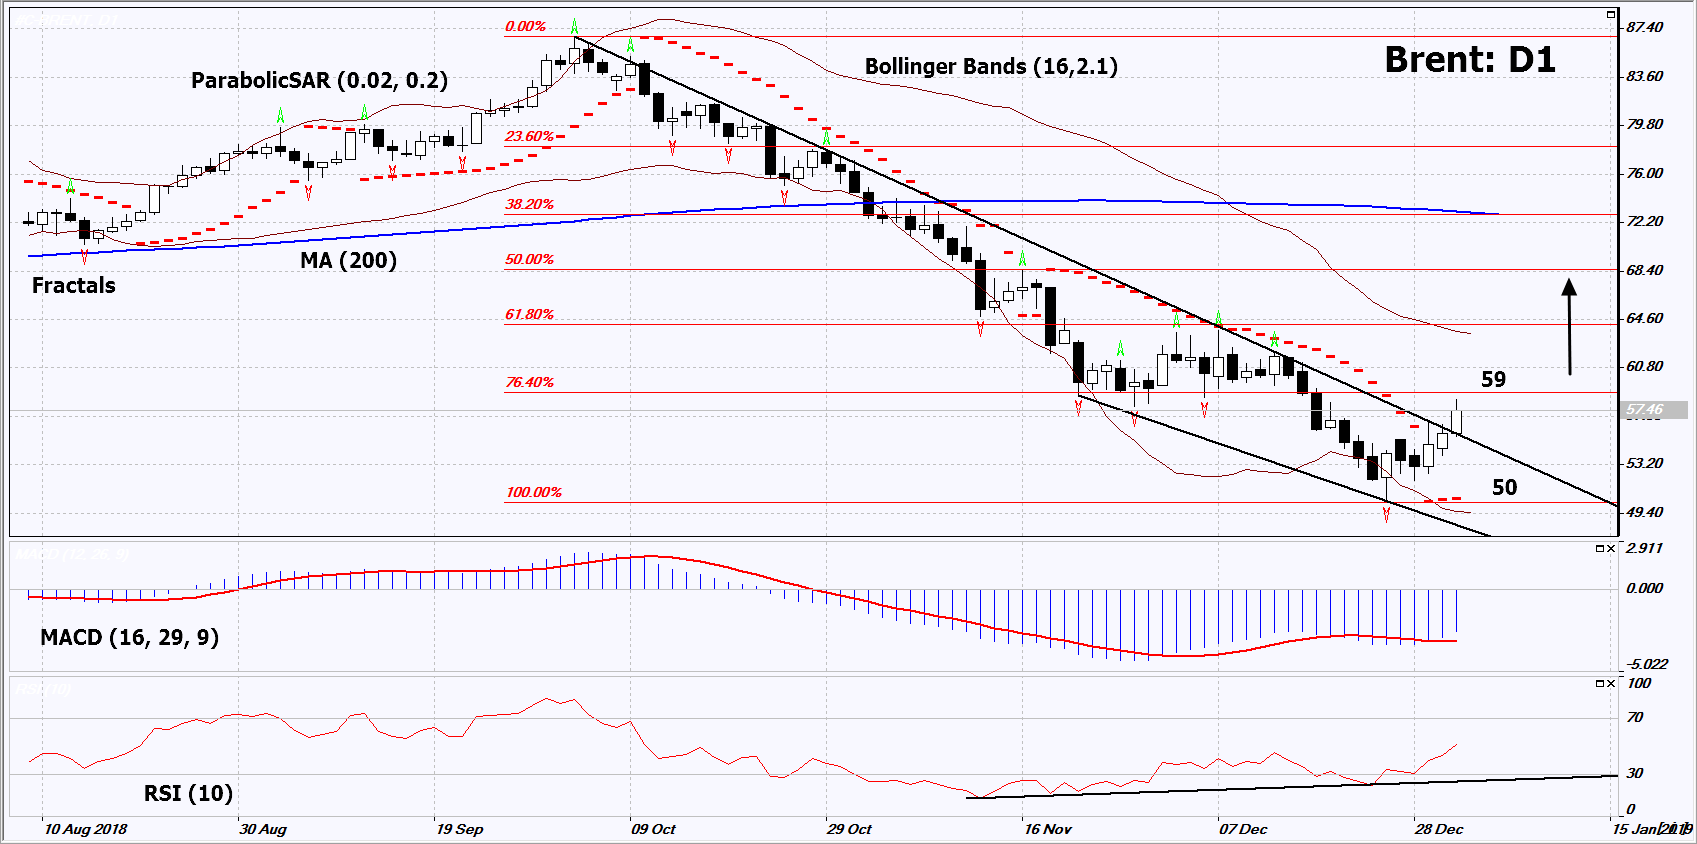
On the daily timeframe, Brent: D1 has broken the downtrend resistance line upwards and adjusts upwards. Further growth of quotations is possible in the event of a reduction in world production and in case of an increase in demand.
- Parabolic indicator shows a signal to increase.
- The Bollinger bands have expanded, indicating a high volatility.
- The RSI indicator is above the 50 mark. It has formed a divergence to increase.
- The MACD indicator shows a signal to increase.
We do not rule out a bullish move if Brent exceeds its last maximum and 1st Fibonacci level: 59. This level can be used as an entry point. The initial risk limit is possibly below the last lower fractal, the minimum since August 2017 and the Parabolic signal: 50. After opening a pending order, move stop following the signals of Bollinger and Parabolic to the next fractal minimum. Thus, we change the potential profit / loss ratio to our advantage. After making a deal, the most cautious traders can switch to a four-hour chart and set a stop loss by moving it in the market direction. If the price overcomes the stop level (50) without activating the order (59), it is recommended to delete the pending order: internal changes occur in the market that were not taken into consideration.
Technical Analysis Summary
| Position | Buy |
| Buy stop | Above 59 |
| Stop loss | Below 50 |
- コースを取って、

【重要な注意事項】:
本レポートは、当社の親会社であるアイエフシーマーケットが作成したものの邦訳です。本レポートには、当社のサービスと商品についての情報を含みますが、お客様の投資目的、財務状況、資金力にかかわらず、情報の提供のみを目的とするものであり、金融商品の勧誘、取引の推奨、売買の提案等を意図したものではありません。 本レポートは、アイエフシーマーケットが信頼できると思われる情報にもとづき作成したものですが、次の点に十分ご留意ください。アイエフシーマーケットおよび当社は、本レポートが提供する情報、分析、予測、取引戦略等の正確性、確実性、完全性、安全性等について一切の保証をしません。アイエフシーマーケットおよび当社は、本レポートを参考にした投資行動が利益を生んだり損失を回避したりすることを保証または約束あるいは言外に暗示するものではありません。アイエフシーマーケットおよび当社は、本レポートに含まれる不確実性、不正確性、不完全性、誤謬、文章上の誤り等に起因して、お客様または第三者が損害(直接的か間接的かを問いません。)を被った場合でも、一切の責任を負いません。
