- マーケット分析
- テクニカル分析
ルーブル対人民元 テクニカル分析 - ルーブル対人民元 取引:2019-05-08
Preparing for US-China trade negotiations and publication of statistics
In this review, we suggest considering the personal composite instrument (PCI) CNHRUB. It reflects the price dynamics of the Chinese yuan against the Russian ruble. Will the CNHRUB rise?
Such a movement on the chart is observed in case of the weakening of the ruble and strengthening of the yuan against the US dollar. A significant positive factor for the Chinese currency may be Vice-Premier Liu He’s visit to the United States for trade negotiations on May 9. Earlier, these negotiations were in question because of US President Donald Trump’s statement about plans to increase duties on Chinese goods. Amid this, on Monday, the yuan fell to the 3.5-month low against the US dollar, but now it has started to recover gradually. Important macroeconomic data on inflation and China’s trade balance for April may affect its exchange rate. They will be released on May 8-9. In turn, the decline in world oil prices, as well as plans of the Central Bank of the Russian Federation to ease the monetary policy have a negative impact on the Russian ruble exchange rate. Inflation in Russia is 5.2% year over year, and the rate of the Central Bank is at a noticeably higher level of 7.75%.
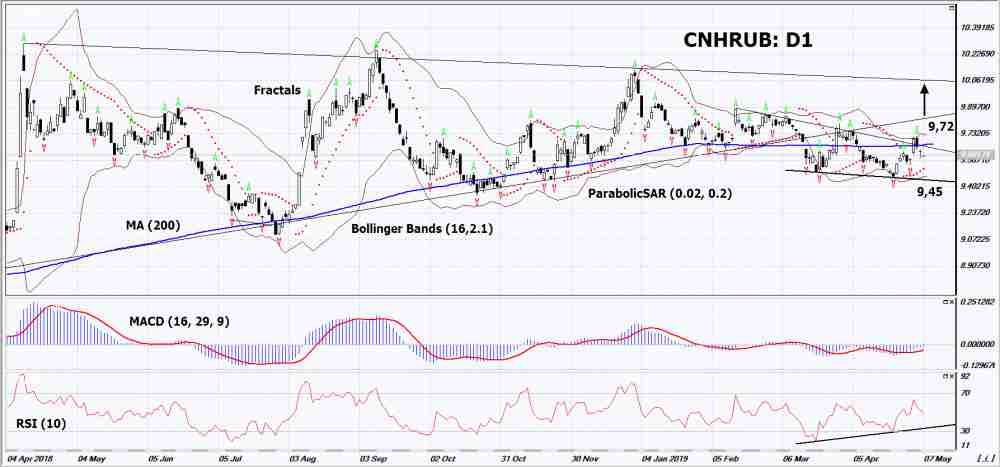
On the daily timeframe, CNHRUB: D1 is in a downtrend, but it has approached its resistance line. Before opening a buy position, the CNHRUB should breached it up. A number of technical analysis indicators formed buy signals. The further price increase is possible in case of positive macroeconomic and political data from China and statements about a rate cut by the Central Bank of the Russian Federation.
- The Parabolic Indicator gives a bullish signal.
- The Bollinger bands have narrowed, which indicates high volatility. The lower Bollinger band is titled upward.
- The RSI indicator is below 50. It has formed a positive divergence.
- The MACD indicator gives a bullish signal.
The bullish momentum may develop in case CNHRUB exceeds the upper Bollinger band, the last fractal high, the 200-moving average line and the resistance line of the downtrend at 9.72. This level may serve as an entry point. The initial stop loss may be placed below the two last fractal lows, the Parabolic signal, the low since November 2017 and the lower Bollinger band at 9.45. After opening the pending order, we shall move the stop to the next fractal low following the Bollinger and Parabolic signals. Thus, we are changing the potential profit/loss to the breakeven point. More risk-averse traders may switch to the 4-hour chart after the trade and place there a stop loss moving it in the direction of the trade. If the price meets the stop level (9.45) without reaching the order (9.72), we recommend to close the position: the market sustains internal changes that were not taken into account.
Summary of technical analysis
| Position | Buy |
| Buy stop | Above 9.72 |
| Stop loss | Below 9.45 |
- コースを取って、

【重要な注意事項】:
本レポートは、当社の親会社であるアイエフシーマーケットが作成したものの邦訳です。本レポートには、当社のサービスと商品についての情報を含みますが、お客様の投資目的、財務状況、資金力にかかわらず、情報の提供のみを目的とするものであり、金融商品の勧誘、取引の推奨、売買の提案等を意図したものではありません。 本レポートは、アイエフシーマーケットが信頼できると思われる情報にもとづき作成したものですが、次の点に十分ご留意ください。アイエフシーマーケットおよび当社は、本レポートが提供する情報、分析、予測、取引戦略等の正確性、確実性、完全性、安全性等について一切の保証をしません。アイエフシーマーケットおよび当社は、本レポートを参考にした投資行動が利益を生んだり損失を回避したりすることを保証または約束あるいは言外に暗示するものではありません。アイエフシーマーケットおよび当社は、本レポートに含まれる不確実性、不正確性、不完全性、誤謬、文章上の誤り等に起因して、お客様または第三者が損害(直接的か間接的かを問いません。)を被った場合でも、一切の責任を負いません。
