- マーケット分析
- テクニカル分析
ココア テクニカル分析 - ココア 取引:2018-12-18
Drought can reduce crop yields
There is a drought in West Africa. Will Cocoa prices rise?
From November to February, a dry season has been observed in Côte d'Ivoire, Ghana, Nigeria, Togo and Cameroon. These five African countries account for three quarters of the world's cocoa production. This year, the drought is stronger there than usual, which can damage crop yields. The US National Weather Service's Climate Prediction Center (CPC) forecasts a 90% chance of formation of the natural phenomenon El Niño in winter of 2018/19 and a 60% probability of its formation in spring of 2019. At the same time, the CPC expects the current El Niño to be weak. The last time it was formed in 2015-2016, and during that period of time, the price of beans exceeded $3000 per ton. It should be noted that currently there is no shortage of cocoa in the world, so the dynamics of quotations can strongly depend on the weather in West Africa.
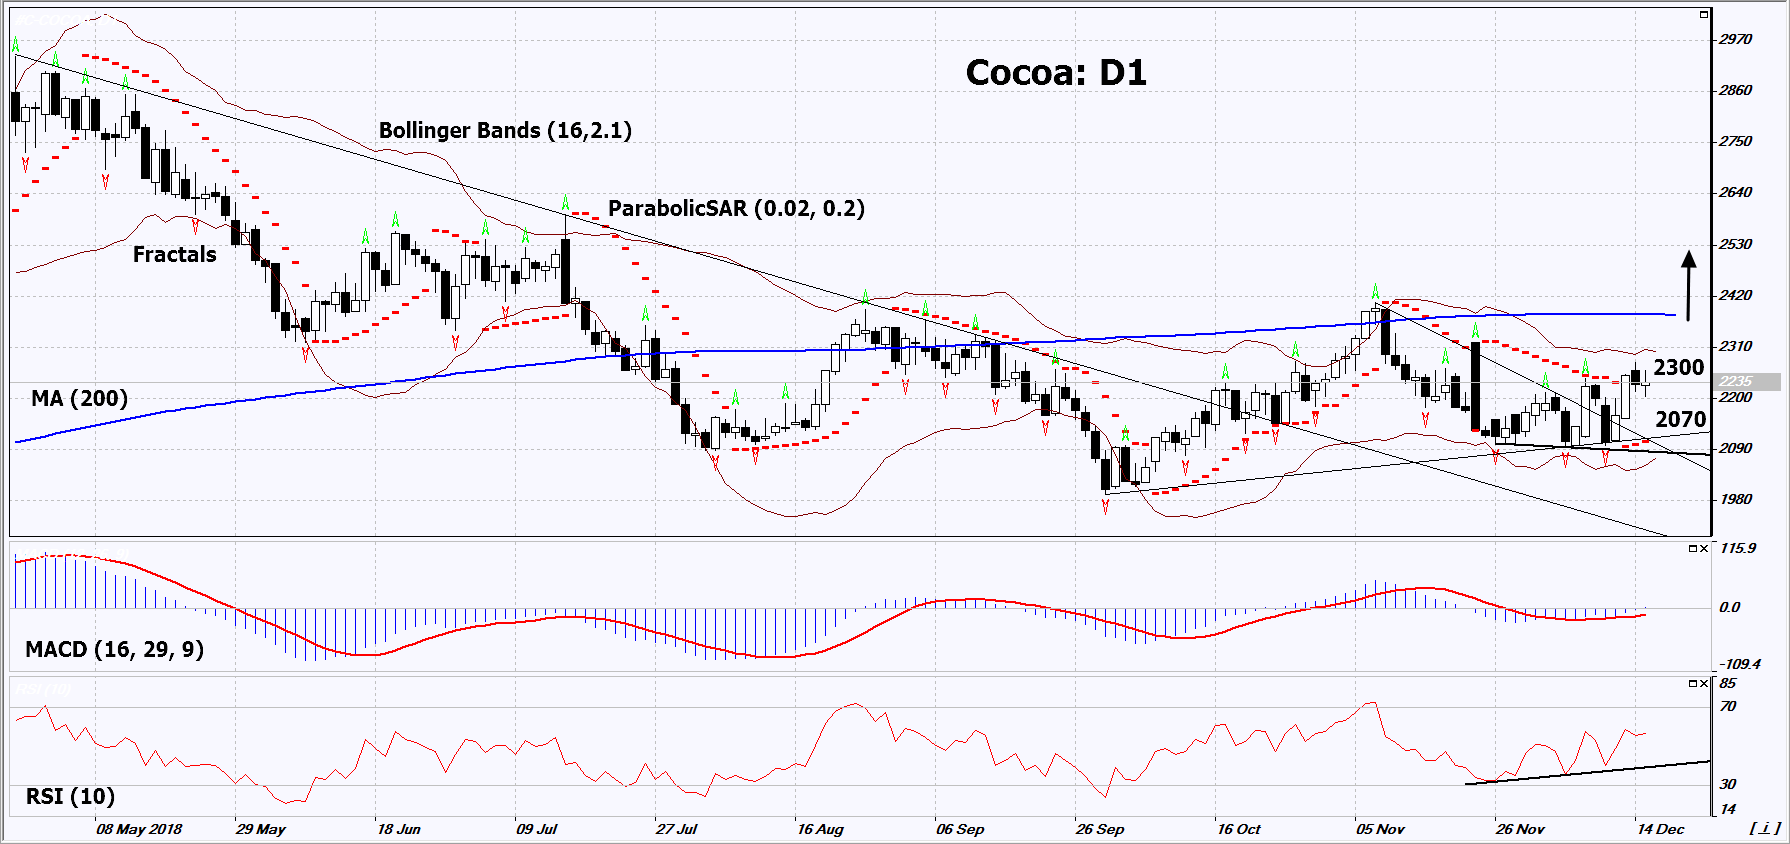
On the daily timeframe, Cocoa: D1 is moving upward within a rising trend. The further price increase is possible in case of a reduction in crop yields in the countries of West Africa.
- The Parabolic indicator gives a bullish signal.
- The Bollinger bands have narrowed, which indicates low volatility. The lower band is titled upward.
- The RSI indicator is above 50. It has formed a positive divergence.
- The MACD indicator gives a bullish signal.
The bullish momentum may develop in case Cocoa exceeds the last fractal high and the upper Bollinger band at 2300. This level may serve as an entry point. The initial stop loss may be placed below the two last fractal lows, the Parabolic signal and the lower Bollinger band at 2070. After opening the pending order, we shall move the stop to the next fractal low following the Bollinger and Parabolic signals. Thus, we are changing the potential profit/loss to the breakeven point. More risk-averse traders may switch to the 4-hour chart after the trade and place there a stop loss moving it in the direction of the trade. If the price meets the stop level (2070) without reaching the order (2300), we recommend to close the position: the market sustains internal changes that were not taken into account.
Summary of technical analysis
| Position | Buy |
| Buy stop | Above 2300 |
| Stop loss | Below 2070 |
- コースを取って、

【重要な注意事項】:
本レポートは、当社の親会社であるアイエフシーマーケットが作成したものの邦訳です。本レポートには、当社のサービスと商品についての情報を含みますが、お客様の投資目的、財務状況、資金力にかかわらず、情報の提供のみを目的とするものであり、金融商品の勧誘、取引の推奨、売買の提案等を意図したものではありません。 本レポートは、アイエフシーマーケットが信頼できると思われる情報にもとづき作成したものですが、次の点に十分ご留意ください。アイエフシーマーケットおよび当社は、本レポートが提供する情報、分析、予測、取引戦略等の正確性、確実性、完全性、安全性等について一切の保証をしません。アイエフシーマーケットおよび当社は、本レポートを参考にした投資行動が利益を生んだり損失を回避したりすることを保証または約束あるいは言外に暗示するものではありません。アイエフシーマーケットおよび当社は、本レポートに含まれる不確実性、不正確性、不完全性、誤謬、文章上の誤り等に起因して、お客様または第三者が損害(直接的か間接的かを問いません。)を被った場合でも、一切の責任を負いません。
