- マーケット分析
- テクニカル分析
ココア テクニカル分析 - ココア 取引:2019-09-09
Cocoa Tree Disease in West Africa
Cocoa Research Institute of Ghana lowered its forecast for cocoa harvest in Ghana by 11% due to the viral disease of the trees Cacao swollen-shoot virus (CSSV). Will the cocoa quotations grow?
The number of infected trees in Ghana is estimated at 16%. This country produces 24% of the world's cocoa and another 35% falls on its neighboring Côte d'Ivoire. In total, three quarters of the world's cocoa is grown in Africa. An additional negative for the crop can be very rainy weather in West Africa. Meanwhile, the European Cocoa Association announced an increase in demand for beans in Europe and an increase in the volume of their processing in the 1st quarter of this year by 3.3% to 370.3 thousand tons compared to the same quarter last year.
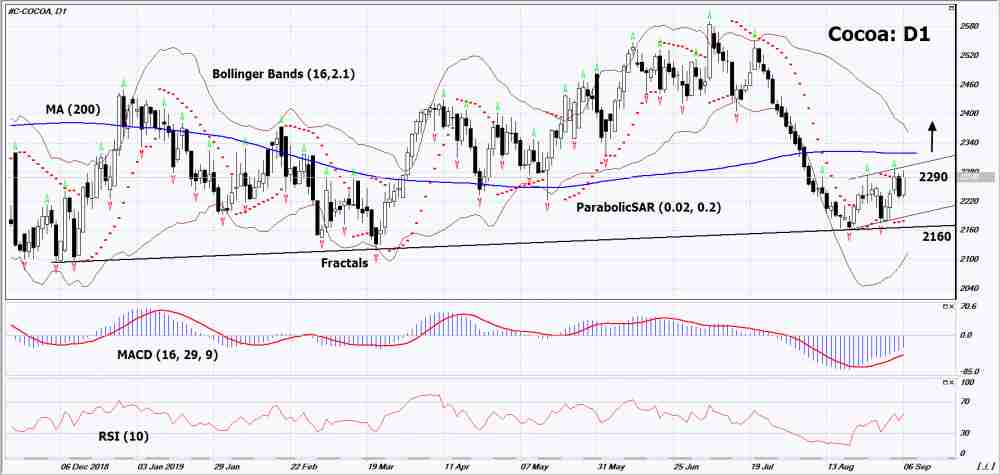
On the daily timeframe Cocoa: D1 could not break the lower bound of a long-term uptrend. Now it is adjusted up. Various technical analysis indicators have generated signals to increase. Further growth of quotations is possible in case of bad weather and a reduction in world crop .
- The Parabolic indicator demonstrates a signal to increase.
- The Bolinger bands widened, indicating high volatility. The bottom line of the Bollinger has a slope up.
- TheRSI indicator is above the mark of 50. Divergence is not observed.
- The MACD indicator gives a bullish signal.
The bullish momentum may develop if Cocoa exceeds the last upper fractal: 2290. This level can be used as an entry point. The initial stop lose may be placed below the last two lower fractals and the Parabolic signal: 2160. After opening the pending order, stop shall be moved following the Bollinger and Parabolic signals to the next fractal minimum. Thus, we are changing the potential profit/loss to the breakeven point. More risk-averse traders may switch to the 4-hour chart after the trade and place a stop loss moving it in the direction of the trade. If the price meets the stop level (2160) without reaching the order (2290), we recommend to cancel the order: the market sustains internal changes that were not taken into account.
Technical Analysis Summary
| Position | Buy |
| Buy stop | Above 2290 |
| Stop loss | Below 2160 |
- コースを取って、

【重要な注意事項】:
本レポートは、当社の親会社であるアイエフシーマーケットが作成したものの邦訳です。本レポートには、当社のサービスと商品についての情報を含みますが、お客様の投資目的、財務状況、資金力にかかわらず、情報の提供のみを目的とするものであり、金融商品の勧誘、取引の推奨、売買の提案等を意図したものではありません。 本レポートは、アイエフシーマーケットが信頼できると思われる情報にもとづき作成したものですが、次の点に十分ご留意ください。アイエフシーマーケットおよび当社は、本レポートが提供する情報、分析、予測、取引戦略等の正確性、確実性、完全性、安全性等について一切の保証をしません。アイエフシーマーケットおよび当社は、本レポートを参考にした投資行動が利益を生んだり損失を回避したりすることを保証または約束あるいは言外に暗示するものではありません。アイエフシーマーケットおよび当社は、本レポートに含まれる不確実性、不正確性、不完全性、誤謬、文章上の誤り等に起因して、お客様または第三者が損害(直接的か間接的かを問いません。)を被った場合でも、一切の責任を負いません。
