- マーケット分析
- テクニカル分析
銅 テクニカル分析 - 銅 取引:2018-11-20
The warming of US-China foreign trade relations may increase the demand for copper
Copper edges higher for the 5th trading session in a row ahead of the G20 summit. Will Copper prices continue rising?
Within the framework of the G20 meeting on December 1, 2018, the President of the People's Republic of China Xi Jinping and the President of the United States Donald Trump will meet. Market participants expect the softening of the mutual foreign trade sanctions of the two countries, which may increase the demand for copper in China. Copper reserves on the LME exchange approached the 10-year low. A noticeable decline in reserves is also noted on the Shanghai Stock Exchange. The agreement between the Chinese copper smelter Jiangxi Copper and the British mining company Antofagasta about reducing the cost of enrichment and processing of copper ore contributed to the increase in demand for copper. The Chilean Copper Commission (Cochilco) forecasts that global copper production, including copper scrap processing, will be 23.5 million tons in 2018, 24 million tons in 2019 and 24.5 million tons in 2020. At the same time, net copper production (excluding scrap processing) will be much less: 20.5 million tons in 2018, 21 million tons in 2019 and 21.3 million tons in 2020. However, global demand, according to Cochilco, will be 23.6 million, 24.1 million and 24.5 million tons during the same period of time. Thus, in 2018–2019, a world shortage of copper is possible, which should be covered by reserves.
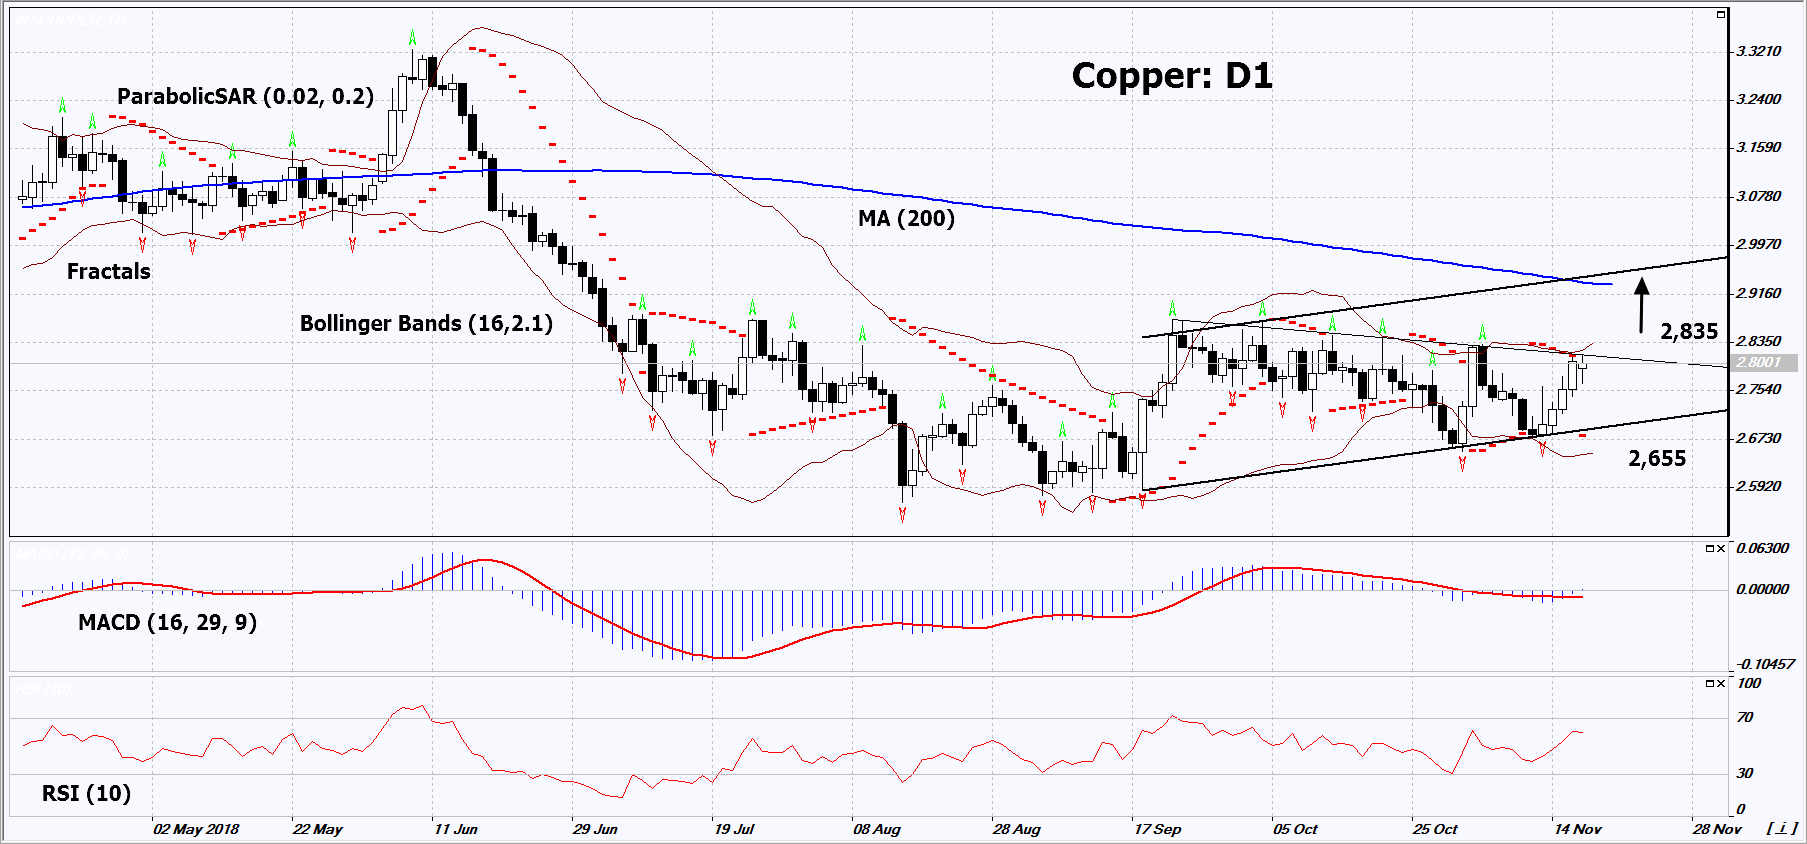
On the daily timeframe, Copper: D1 is correcting upward within the medium-term rising channel and approached the resistance line of the short-term downtrend. A number of technical analysis indicators formed buy signals. The further price growth is possible in case of an increase in global demand.
- The Parabolic indicator gives a bullish signal.
- The Bollinger bands have widened, which indicates high volatility. Both bands are titled upwards.
- The RSI indicator is above 50. No divergence.
- The MACD indicator gives a bullish signal.
The bullish momentum may develop in case Copper exceeds the last fractal high, the resistance line of the short-term downtrend and the upper Bollinger band at 2.835. This level may serve as an entry point. The initial stop loss may be placed below the two last fractal lows, the Parabolic signal and the lower Bollinger band at 2.655. After opening the pending order, we shall move the stop to the next fractal low following the Bollinger and Parabolic signals. Thus, we are changing the potential profit/loss to the breakeven point. More risk-averse traders may switch to the 4-hour chart after the trade and place there a stop loss moving it in the direction of the trade. If the price meets the stop level (2.655) without reaching the order (2.835), we recommend cancelling the position: the market sustains internal changes that were not taken into account.
Summary of technical analysis
| Position | Buy |
| Buy stop | Above 2.835 |
| Stop loss | Below 2.655 |
- コースを取って、

【重要な注意事項】:
本レポートは、当社の親会社であるアイエフシーマーケットが作成したものの邦訳です。本レポートには、当社のサービスと商品についての情報を含みますが、お客様の投資目的、財務状況、資金力にかかわらず、情報の提供のみを目的とするものであり、金融商品の勧誘、取引の推奨、売買の提案等を意図したものではありません。 本レポートは、アイエフシーマーケットが信頼できると思われる情報にもとづき作成したものですが、次の点に十分ご留意ください。アイエフシーマーケットおよび当社は、本レポートが提供する情報、分析、予測、取引戦略等の正確性、確実性、完全性、安全性等について一切の保証をしません。アイエフシーマーケットおよび当社は、本レポートを参考にした投資行動が利益を生んだり損失を回避したりすることを保証または約束あるいは言外に暗示するものではありません。アイエフシーマーケットおよび当社は、本レポートに含まれる不確実性、不正確性、不完全性、誤謬、文章上の誤り等に起因して、お客様または第三者が損害(直接的か間接的かを問いません。)を被った場合でも、一切の責任を負いません。
