- マーケット分析
- テクニカル分析
綿花 テクニカル分析 - 綿花 取引:2019-07-02
Leaders of the United States and China have agreed to resume trade negotiations
At the G20 meeting last weekend, Chinese Chairman Xi Jinping and US president Donald Trump agreed to resume trade negotiations between the countries. Will the Cotton quotations increase?
The American president expressed the hope that China will acquire more agricultural products from the United States. China acquires about a quarter of global cotton imports and is the largest importer. The United States ranks 1st in the world in the export of cotton with a share of about 38%. After the announcement of the successful conclusion of negotiations between the leaders of the United States and China, the cotton quotations soared by 3% and updated a maximum of a month. An additional positive factor could be a reduction in the forecast for cotton crop area in the US in the agricultural season 2019/20 from U.S. Department of Agriculture (USDA). In the June forecast of the US Department of Agriculture, an area of 13.72 million acres is indicated, which is less than its March estimate of 13.78 million acres. The India Meteorological Department reported that June this year turned out to be the driest in the last 5 years and the amount of precipitation decreased by about a third compared with the average level. Drought can reduce cotton production in India.
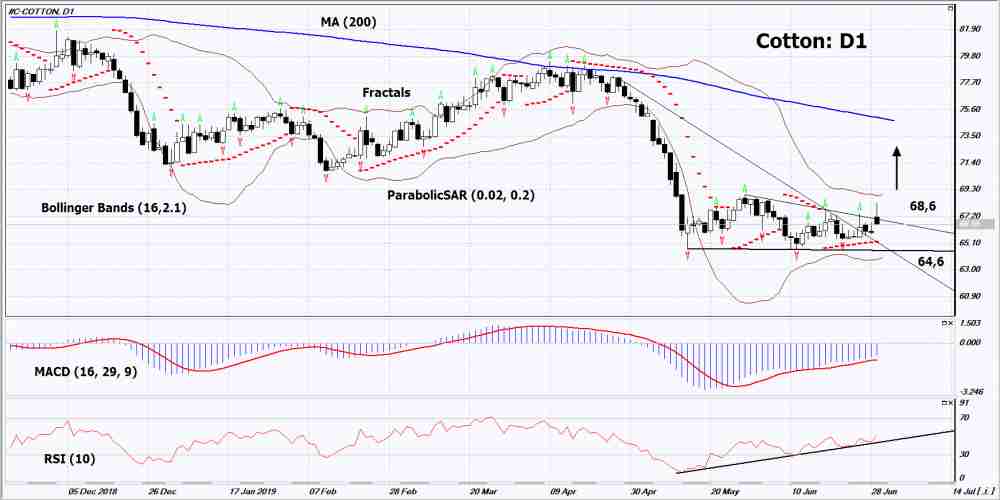
On the daily timeframe Cotton: D1 is trying to exit the downtrend and from the triangle to the top. Various technical analysis indicators have generated an uptrend signals. Further growth of quotations is possible in case of an increase in global demand and deterioration of the weather in India.
- The Parabolic indicator shows a signal to increase.
- The Bolinger bandsnarrowed, indicating a volatility decrease. Both lines of Bollinger have a slope up.
- The RSI indicator is above the 50 mark. It has formed a divergence to the increase.
- The MACD indicator shows a signal to increase.
The billish momentum may develop if the Cotton exceeds its last maximum: 68.6. This level can be used as an entry point. The initial stop lose may be placed below the last three lower fractals, the Parabolic signal and a 3-year low: 64.6. After placing the pending order, the stop loss shall be moved following the signals of Bollinger and Parabolic to the next fractal minimum.Thus, we are changing the potential profit/loss to the breakeven point. More risk-averse traders may switch to the 4-hour chart after the trade and place a stop loss moving it in the direction of the trade. If the price meets the stop level (64,6)) without reaching the order (68,6), we recommend to cancel the order: the market sustains internal changes that were not taken into account.
Technical Analysis Summary
| Position | Buy |
| Buy stop | Above 68,6 |
| Stop loss | Below 64,6 |
- コースを取って、

【重要な注意事項】:
本レポートは、当社の親会社であるアイエフシーマーケットが作成したものの邦訳です。本レポートには、当社のサービスと商品についての情報を含みますが、お客様の投資目的、財務状況、資金力にかかわらず、情報の提供のみを目的とするものであり、金融商品の勧誘、取引の推奨、売買の提案等を意図したものではありません。 本レポートは、アイエフシーマーケットが信頼できると思われる情報にもとづき作成したものですが、次の点に十分ご留意ください。アイエフシーマーケットおよび当社は、本レポートが提供する情報、分析、予測、取引戦略等の正確性、確実性、完全性、安全性等について一切の保証をしません。アイエフシーマーケットおよび当社は、本レポートを参考にした投資行動が利益を生んだり損失を回避したりすることを保証または約束あるいは言外に暗示するものではありません。アイエフシーマーケットおよび当社は、本レポートに含まれる不確実性、不正確性、不完全性、誤謬、文章上の誤り等に起因して、お客様または第三者が損害(直接的か間接的かを問いません。)を被った場合でも、一切の責任を負いません。
