- マーケット分析
- テクニカル分析
Walt Disney テクニカル分析 - Walt Disney 取引:2019-06-18
Disney competitive advantage supports a bullish view for its stock
Analysts point to conservative Disney estimates of subscriptions as the company prepares to launch new services in fall. Will the Disney stock price continue rebounding?
Disney reported $1.61 earnings per share on revenue of $14.92 billion in its fiscal second quarter ended March 30. Both earnings and revenue beat expectations forecast at $1.57 per share on revenue of $14.53 billion. The outperformance was accredited to revenue from its Parks, Experiences and Products segment which rose 5% to $6.2 billion. Morgan Stanley upgraded the stock to buy a week ago, raising their price target on the stock to $160 from $135. Investors are potentially underestimating just how quickly Disney could become a major player in the streaming market, analysts say. Disney is planning to launch its over-the-top streaming service Disney+ on November 12. It has set subscription price at $6.99 per month, while Netflix 's least expensive plan is $8.99 per month. Morgan Stanley estimates Disney will attract at least 130 million total subscribers by 2024, while Disney forecast total streaming subscribers of 135 million by 2024 at the midpoint of its guidance. Disney competitive advantage over rivals supports a bullish view for its stock.
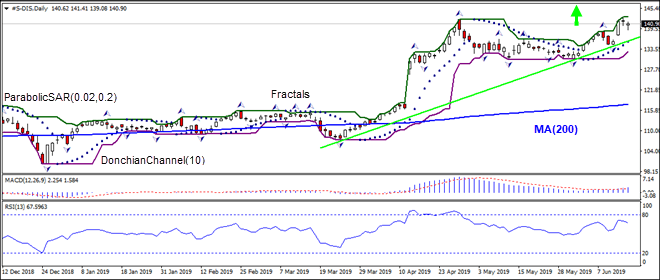
On the daily timeframe the S-DIS: D1 is rising above the support line. It is above the 200-day moving average MA(200) which is also rising. This is bullish.
- The Parabolic indicator gives a buy signal.
- The Donchian channel indicates uptrend: it is tilted up.
- The MACD indicator gives a bullish signal: it is above the signal line and the gap is widening.
- The RSI oscillator is falling but has not reached the oversold zone yet.
We believe the bullish momentum will continue after the price breaches above the upper boundary of Donchian channel at 142.88. This level can be used as an entry point for placing a pending order to buy. The stop loss can be placed below the fractal low at 133.12. After placing the order, the stop loss is to be moved every day to the next fractal low, following Parabolic signals. Thus, we are changing the expected profit/loss ratio to the breakeven point. If the price meets the stop loss level (133.12) without reaching the order (142.88), we recommend cancelling the order: the market has undergone internal changes which were not taken into account.
Technical Analysis Summary
| Order | Buy |
| Buy stop | Above 142.88 |
| Stop loss | Below 133.12 |
- コースを取って、

【重要な注意事項】:
本レポートは、当社の親会社であるアイエフシーマーケットが作成したものの邦訳です。本レポートには、当社のサービスと商品についての情報を含みますが、お客様の投資目的、財務状況、資金力にかかわらず、情報の提供のみを目的とするものであり、金融商品の勧誘、取引の推奨、売買の提案等を意図したものではありません。 本レポートは、アイエフシーマーケットが信頼できると思われる情報にもとづき作成したものですが、次の点に十分ご留意ください。アイエフシーマーケットおよび当社は、本レポートが提供する情報、分析、予測、取引戦略等の正確性、確実性、完全性、安全性等について一切の保証をしません。アイエフシーマーケットおよび当社は、本レポートを参考にした投資行動が利益を生んだり損失を回避したりすることを保証または約束あるいは言外に暗示するものではありません。アイエフシーマーケットおよび当社は、本レポートに含まれる不確実性、不正確性、不完全性、誤謬、文章上の誤り等に起因して、お客様または第三者が損害(直接的か間接的かを問いません。)を被った場合でも、一切の責任を負いません。
