- マーケット分析
- テクニカル分析
Dow Jones Industrial Average (30), 株価指数 テクニカル分析 - Dow Jones Industrial Average (30), 株価指数 取引:2019-02-07
Strong data bullish for DJI
Dow Jones Industrial Average (30), 株価指数 チャート分析
, 株価指数 チャート分析")
Dow Jones Industrial Average (30), 株価指数 テクニカル分析
Continuing expansion in private sector indicates US economy is strong. Will the DJI continue the rebound?
Data after the Federal Reserve January 29-30 meeting were positive on balance indicating the US economy is strong. The Institute of Supply Management's manufacturing index’s final reading for January came in better than expected. The US economy created above-expected 304,000 new jobs in January as labor force participation rose. And while the services section expansion slowed in January, the expansion still continued at robust pace with employment and prices rising in the sector. The only weak spot were the drop in factory orders for November. Positive economic data are bullish for Dow Jones US stock index.
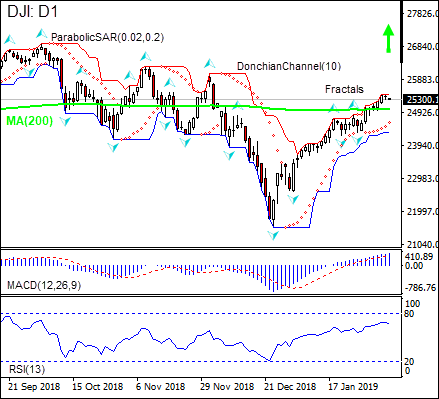
On the daily timeframe the DJI: D1 is above the 200-day moving average MA(200), this is bullish.
- The Parabolic indicator gives a buy signal.
- The Donchian channel indicates no trend yet: it is flat.
- The MACD indicator gives a bullish signal: it is above the signal line and the gap is widening.
- The RSI oscillator is falling but has not reached the oversold zone yet.
We believe the bullish momentum will continue after the price closes above the upper boundary of Donchian channel at 25434.7. This level can be used as an entry point for placing a pending order to buy. The stop loss can be placed below the fractal low at 24315.6. After placing the order, the stop loss is to be moved every day to the next fractal low, following Parabolic signals. Thus, we are changing the expected profit/loss ratio to the breakeven point. If the price meets the stop loss level (24315.6) without reaching the order (25434.7), we recommend cancelling the order: the market has undergone internal changes which were not taken into account.
Technical Analysis Summary
| Position | Buy |
| Buy stop | Above 25434.7 |
| Stop loss | Below 24315.6 |
分析 - "}[/T]
- コースを取って、

【重要な注意事項】:
本レポートは、当社の親会社であるアイエフシーマーケットが作成したものの邦訳です。本レポートには、当社のサービスと商品についての情報を含みますが、お客様の投資目的、財務状況、資金力にかかわらず、情報の提供のみを目的とするものであり、金融商品の勧誘、取引の推奨、売買の提案等を意図したものではありません。 本レポートは、アイエフシーマーケットが信頼できると思われる情報にもとづき作成したものですが、次の点に十分ご留意ください。アイエフシーマーケットおよび当社は、本レポートが提供する情報、分析、予測、取引戦略等の正確性、確実性、完全性、安全性等について一切の保証をしません。アイエフシーマーケットおよび当社は、本レポートを参考にした投資行動が利益を生んだり損失を回避したりすることを保証または約束あるいは言外に暗示するものではありません。アイエフシーマーケットおよび当社は、本レポートに含まれる不確実性、不正確性、不完全性、誤謬、文章上の誤り等に起因して、お客様または第三者が損害(直接的か間接的かを問いません。)を被った場合でも、一切の責任を負いません。
