- マーケット分析
- テクニカル分析
EUR/GBP テクニカル分析 - EUR/GBP 取引:2018-07-09
Will there be a soft Brexit?
Market participants believe that the UK will not be able to agree with European officials on a number of benefits in case of the withdrawal from the EU. Will the EURGBP grow, if there will not be the so-called "soft Brexit"?
British Prime Minister Teresa May will present her plan for Brexit in the parliament of her country on Friday night. Earlier, British Foreign Secretary Boris Johnson and former Prime Minister (2010-2016) David Cameron said that it is the worst of all possible options. In addition, according to The Guardian, the head of the British Brexit commission David Davis said that the new customs proposals of Therese May look "unworkable" and expressed the view that the EU would reject her plan. In July 10, significant macroeconomic indicators for May will be published in the UK: the industrial production, the monthly GDP and the trade balance. It should be emphasized that the success of the UK in negotiations on the withdrawal from the EU can reverse EURGBP down. An important factor may be the visit of Donald Trump to Great Britain on July 12.
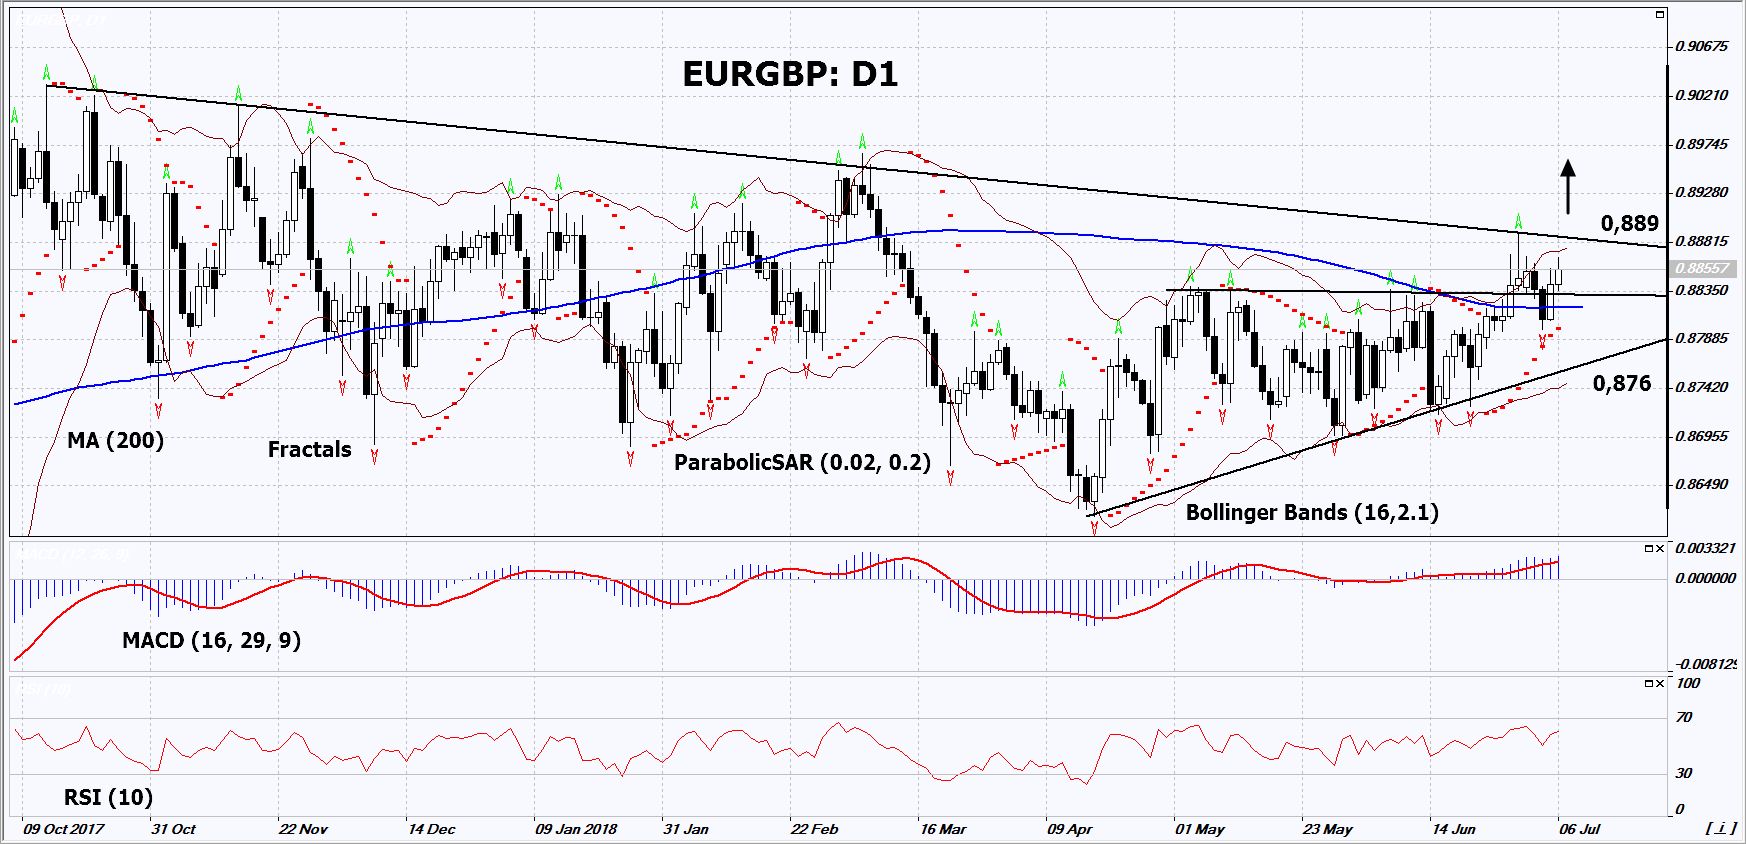
On the daily timeframe, EURGBP: D1 is trying to move upward from the triangle and has approached the resistance line of the long-term falling channel. It should be breached up before opening a buy position. The further price increase is possible in case of successful negotiations on Brexit for the UK.
- The Parabolic indicator gives a bullish signal.
- The Bollinger bands have widened, which indicates high volatility. They are titled upward.
- The RSI indicator is above 50. No divergence.
- The MACD indicator gives a bullish signal.
The bullish momentum may develop in case EURGBP exceeds the last high, the upper Bollinger band and the resistance line of the downtrend at 0.889. This level may serve as an entry point. The initial stop loss may be placed below the last fractal low, the 200-day moving average line, the Parabolic signal and the support line of the triangle at 0.876. After opening the pending order, we shall move the stop to the next fractal low following the Bollinger and Parabolic signals. Thus, we are changing the potential profit/loss to the breakeven point. More risk-averse traders may switch to the 4-hour chart after the trade and place there a stop loss moving it in the direction of the trade. If the price meets the stop level (0.876) without reaching the order (0.889), we recommend to close the position: the market sustains internal changes that were not taken into account.
Summary of technical analysis
| Position | Buy |
| Buy stop | Above 0.889 |
| Stop loss | Below 0.876 |
- コースを取って、

【重要な注意事項】:
本レポートは、当社の親会社であるアイエフシーマーケットが作成したものの邦訳です。本レポートには、当社のサービスと商品についての情報を含みますが、お客様の投資目的、財務状況、資金力にかかわらず、情報の提供のみを目的とするものであり、金融商品の勧誘、取引の推奨、売買の提案等を意図したものではありません。 本レポートは、アイエフシーマーケットが信頼できると思われる情報にもとづき作成したものですが、次の点に十分ご留意ください。アイエフシーマーケットおよび当社は、本レポートが提供する情報、分析、予測、取引戦略等の正確性、確実性、完全性、安全性等について一切の保証をしません。アイエフシーマーケットおよび当社は、本レポートを参考にした投資行動が利益を生んだり損失を回避したりすることを保証または約束あるいは言外に暗示するものではありません。アイエフシーマーケットおよび当社は、本レポートに含まれる不確実性、不正確性、不完全性、誤謬、文章上の誤り等に起因して、お客様または第三者が損害(直接的か間接的かを問いません。)を被った場合でも、一切の責任を負いません。
