- マーケット分析
- テクニカル分析
フィーダー牛 テクニカル分析 - フィーダー牛 取引:2019-07-01
Getting ready for the publication of the USDA report
U.S. The Department of Agriculture (USDA) reported that by the end of May this year, frozen beef stocks in the United States were 13% lower than the same period in 2018. Will the Fcattle quotations increase?
According to the USDA, the daily slaughter of cattle (cattle) in the United States last week amounted to 122 thousand heads, which is almost 2% more than last year. We also note that by June 1 of this year, the number of cattle in the US feedlots reached a historical maximum of 11.7 million heads, which was 2% on June 1, 2018. Meanwhile, in May, deliveries of cows to feedlots decreased by 3% from last year’s level. If this trend of reduction has lasted in June, then the livestock as of July 1 may decrease. This is able to push quotes up. June data will be published on July 19.
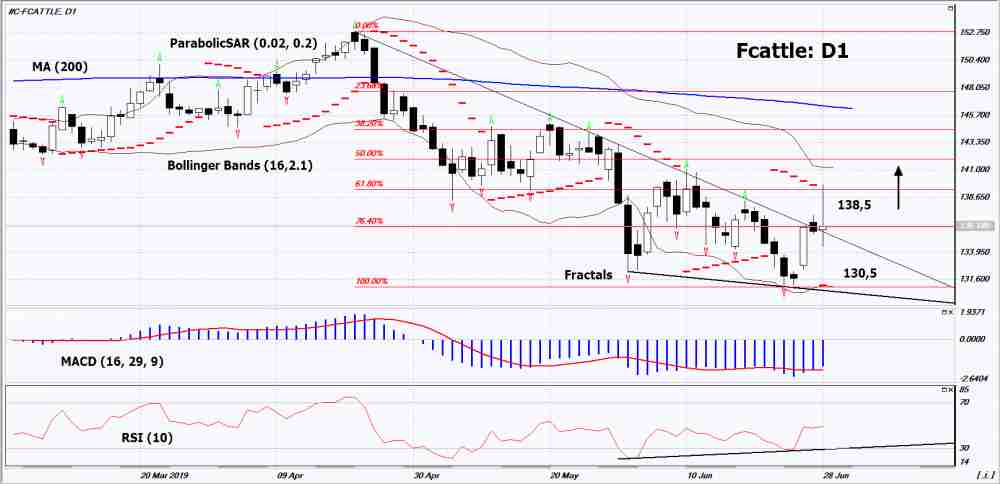
On the daily timeframe Fcattle: D1 broke up the downtrend resistance line. Various technical analysis indicators have generated uptrend signals. Further growth of quotations is possible in case of reduction in the number of cattle at feedlots in the USA.
- The Parabolic indicator indicates an uptrend signal.
- The Bolinger bands narrowed, indicating volatility decrease.
- The RSI indicator is near the 50 mark. It has formed a divergence to increase.
- The MACD indicator indicates bullish signal.
The bullish momentum may develop in case if Fcattle exceeds its last upper fractal: 138.5. This level can be used as an entry point. The stop loss can be placed lower than the last minimum (since April 2018), the Parabolic signal, the lower Bollinger line and the last lower fractal: 130.5. After placing the order, the stop loss shall be moved following the signals of Bollinger and Parabolic to the next fractal minimum. Thus, we are changing the potential profit/loss to the breakeven point. More risk-averse traders may switch to the 4-hour chart after the trade and place a stop loss moving it in the direction of the trade. If the price meets the stop level (130,5) without reaching the order (138,5), we recommend to cancel the order: the market sustains internal changes that were not taken into account.
Technical Analysis Summary
| Position | Buy |
| Buy stop | Above 138,5 |
| Stop loss | Below 130,5 |
- コースを取って、

【重要な注意事項】:
本レポートは、当社の親会社であるアイエフシーマーケットが作成したものの邦訳です。本レポートには、当社のサービスと商品についての情報を含みますが、お客様の投資目的、財務状況、資金力にかかわらず、情報の提供のみを目的とするものであり、金融商品の勧誘、取引の推奨、売買の提案等を意図したものではありません。 本レポートは、アイエフシーマーケットが信頼できると思われる情報にもとづき作成したものですが、次の点に十分ご留意ください。アイエフシーマーケットおよび当社は、本レポートが提供する情報、分析、予測、取引戦略等の正確性、確実性、完全性、安全性等について一切の保証をしません。アイエフシーマーケットおよび当社は、本レポートを参考にした投資行動が利益を生んだり損失を回避したりすることを保証または約束あるいは言外に暗示するものではありません。アイエフシーマーケットおよび当社は、本レポートに含まれる不確実性、不正確性、不完全性、誤謬、文章上の誤り等に起因して、お客様または第三者が損害(直接的か間接的かを問いません。)を被った場合でも、一切の責任を負いません。
