- マーケット分析
- テクニカル分析
金融業界指標 テクニカル分析 - 金融業界指標 取引:2019-02-11
World central banks lower economic growth forecasts
In this review, we suggest considering the personal composite instrument (PCI) “Financial Stock Index”. It reflects the price dynamics of the stock portfolio of 10 largest companies from the US finance industry, which are traded on New York Stock Exchange (NYSE). Will the Finance_Stocks fall?
The Federal Reserve Bank of New York lowered its forecast for the US GDP growth in 2018 to 2.4% from 2.6%, as well as the forecast for GDP in the first quarter of 2019 to 2.2% from 2.4%. Data on economic growth over the past year will be published on February 28, 2019. Its possible slowdown may lower the likelihood of the Fed rate hike and have a negative impact on stocks of the financial sector. The next Fed meeting will be held in late March. Let us recall that earlier the ECB and the Bank of England reduced GDP growth forecasts for their countries. More than half of the companies from the list of the S&P 500 stock index have already published earnings reports for the 4th quarter of 2018. Market participants slightly lowered the estimate of the quarterly growth in the total profit of the S&P 500 to + 5.1% from + 5.3% expected before the start of the reporting season.
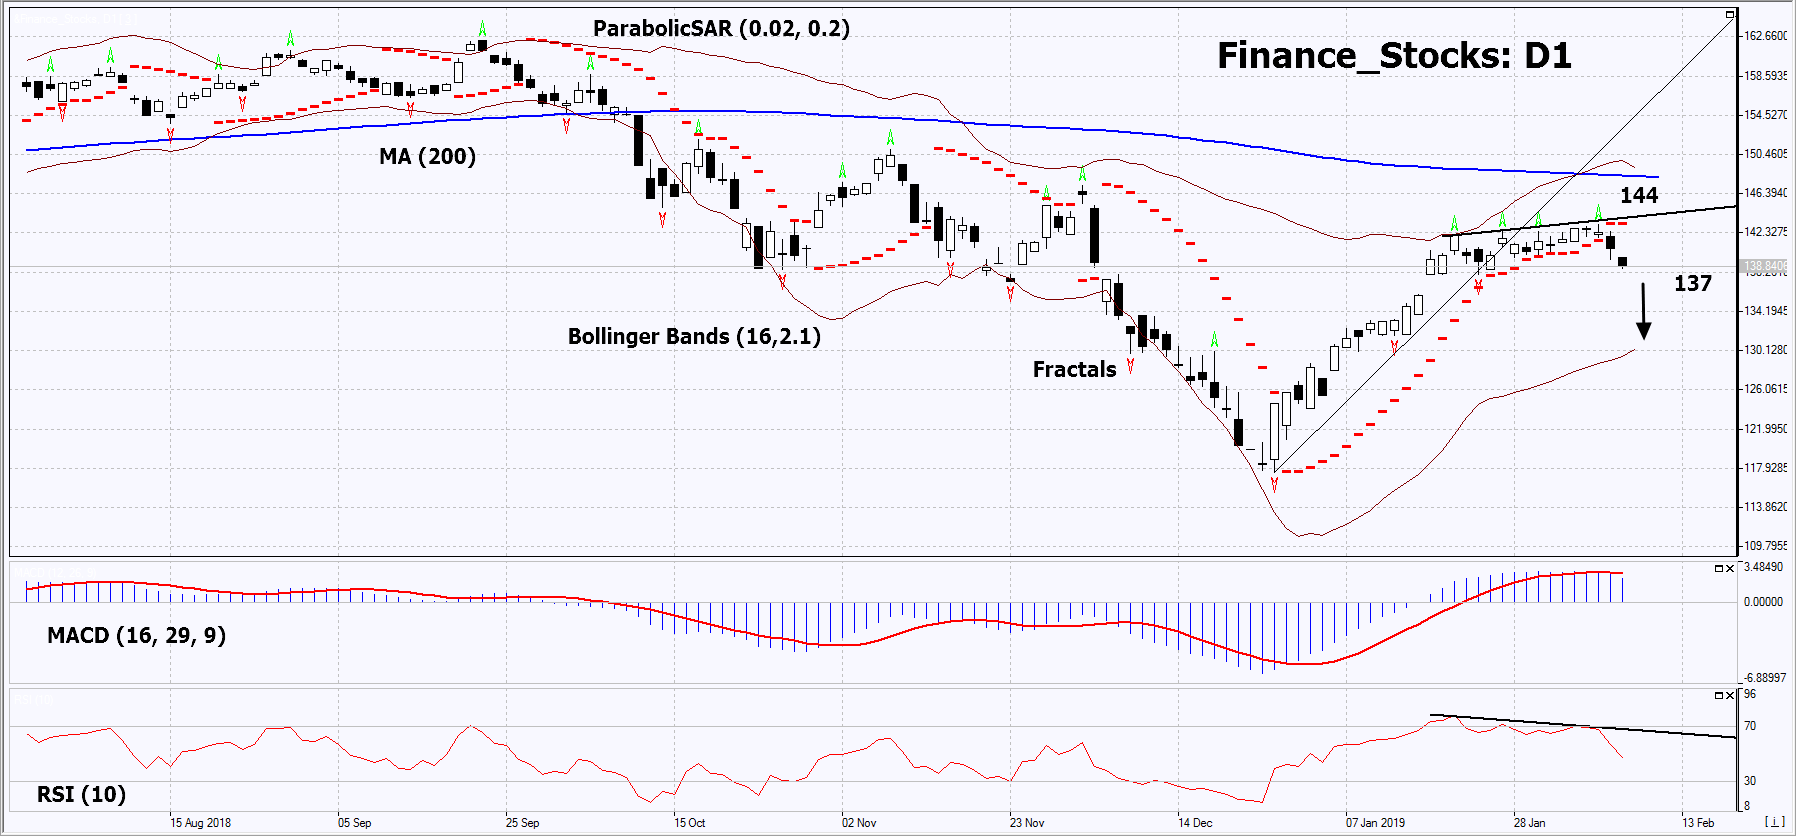
On the daily timeframe, Finance_Stocks: D1 moved from the rising trend to the neutral one. A number of technical analysis indicators formed sell signals. It is possible in case of the publication of negative corporate information in the US and reduction in the likelihood of the Fed rate hike.
- The Parabolic indicator gives a bearish signal.
- The Bollinger bands have widened, which indicates high volatility. The upper band is titled down.
- The RSI indicator is below 50. It has formed a negative divergence.
- The MACD indicator gives a bearish signal.
The bearish momentum may develop in case Finance_Stocks falls below the last fractal low at 137. This level may serve as an entry point. The initial stop loss may be placed above the last fractal high and the Parabolic signal at 144. After opening the pending order, we shall move the stop to the next fractal low following the Bollinger and Parabolic signals. Thus, we are changing the potential profit/loss to the breakeven point. More risk-averse traders may switch to the 4-hour chart after the trade and place there a stop loss moving it in the direction of the trade. If the price meets the stop level (137) without reaching the order (144), we recommend to close the position: the market sustains internal changes that were not taken into account.
Summary of technical analysis
| Position | Sell |
| Sell stop | Below 137 |
| Stop loss | Above 144 |
- コースを取って、

【重要な注意事項】:
本レポートは、当社の親会社であるアイエフシーマーケットが作成したものの邦訳です。本レポートには、当社のサービスと商品についての情報を含みますが、お客様の投資目的、財務状況、資金力にかかわらず、情報の提供のみを目的とするものであり、金融商品の勧誘、取引の推奨、売買の提案等を意図したものではありません。 本レポートは、アイエフシーマーケットが信頼できると思われる情報にもとづき作成したものですが、次の点に十分ご留意ください。アイエフシーマーケットおよび当社は、本レポートが提供する情報、分析、予測、取引戦略等の正確性、確実性、完全性、安全性等について一切の保証をしません。アイエフシーマーケットおよび当社は、本レポートを参考にした投資行動が利益を生んだり損失を回避したりすることを保証または約束あるいは言外に暗示するものではありません。アイエフシーマーケットおよび当社は、本レポートに含まれる不確実性、不正確性、不完全性、誤謬、文章上の誤り等に起因して、お客様または第三者が損害(直接的か間接的かを問いません。)を被った場合でも、一切の責任を負いません。
