- マーケット分析
- テクニカル分析
フランス40指数 テクニカル分析 - フランス40指数 取引:2018-12-28
Weaker French data bearish for FR40
Third quarter French economic growth was revised lower. Will the FR 40 continue declining?
Recent French economic data were negative: French Q3 GDP growth was revised lower. French economy expanded 1.4% year-over-year in the third quarter, down from an upwardly revised 1.7% growth in the previous three-month period. The economic growth rate over previous quarter was revised lower to 0.3% in the three months to September 2018, compared to a near one-year high of 0.4% initial estimate. And while household consumption grew by 0.4% and fixed investment by businesses also grew faster there are significant downside external and internal risks for fourth quarter GDP. Internally, the ‘yellow vest’ protests in response to a proposed fuel-tax hike will have a negative effect on output, and externally protracted US-China trade dispute and uncertainty surrounding its outcome is hurting global growth prospects. Weak economic data are bearish for French stock index FR 40.
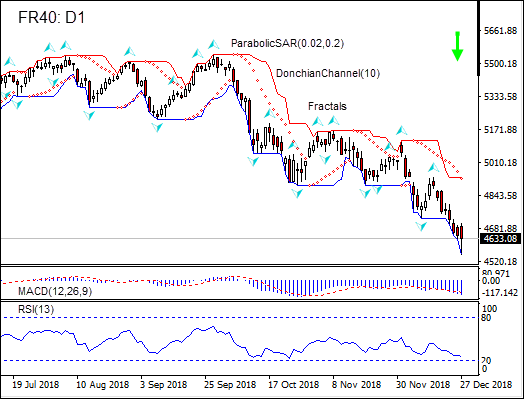
On the daily timeframe the FR40: D1 is declining after retracing to 6-month high in the end of September.
- The Parabolic indicator gives a sell signal.
- The Donchian channel indicates downtrend: it is tilted lower.
- The MACD indicator gives a bearish signal: it is below the signal line and the gap is widening.
- The Stochastic oscillator has breached into the oversold zone, this is bullish.
We believe the bearish momentum will continue after the price closes below the lower boundary of Donchian channel at 4553.58. This level can be used as an entry point for placing a pending order to sell. The stop loss can be placed above the last fractal high at 4935.02. After placing the order, the stop loss is to be moved every day to the next fractal high, following Parabolic signals. Thus, we are changing the expected profit/loss ratio to the breakeven point. If the price meets the stop loss level (4935.02) without reaching the order (4553.58), we recommend cancelling the order: the market has undergone internal changes which were not taken into account.
Technical Analysis Summary
| Position | Sell |
| Sell stop | Below 4553.58 |
| Stop loss | Above 4935.02 |
- コースを取って、

【重要な注意事項】:
本レポートは、当社の親会社であるアイエフシーマーケットが作成したものの邦訳です。本レポートには、当社のサービスと商品についての情報を含みますが、お客様の投資目的、財務状況、資金力にかかわらず、情報の提供のみを目的とするものであり、金融商品の勧誘、取引の推奨、売買の提案等を意図したものではありません。 本レポートは、アイエフシーマーケットが信頼できると思われる情報にもとづき作成したものですが、次の点に十分ご留意ください。アイエフシーマーケットおよび当社は、本レポートが提供する情報、分析、予測、取引戦略等の正確性、確実性、完全性、安全性等について一切の保証をしません。アイエフシーマーケットおよび当社は、本レポートを参考にした投資行動が利益を生んだり損失を回避したりすることを保証または約束あるいは言外に暗示するものではありません。アイエフシーマーケットおよび当社は、本レポートに含まれる不確実性、不正確性、不完全性、誤謬、文章上の誤り等に起因して、お客様または第三者が損害(直接的か間接的かを問いません。)を被った場合でも、一切の責任を負いません。
