- マーケット分析
- テクニカル分析
フランス40指数 テクニカル分析 - フランス40指数 取引:2019-06-20
Positive data bullish for FR40
French retail sales increase and private business sector expansion were better than expected. Will the FR40 advance continue?
Recent French economic data were better than expected after final Q1 GDP report: Markit’s final reading of composite purchasing managers index for May confirmed business activity expansion accelerated in May with services sector also recording an expansion. And retail sales growth increased in April: retail sales rose 3.1% over year after 1.2% increase in March. At the same time trade deficit declined to 5 billion euro from 5.5 billion in March. Positive French data are bullish for FR40.
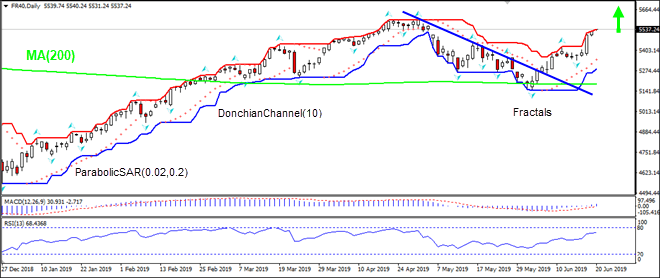
On the daily timeframe FR40: D1 is retracing higher after hitting 4-month low in the beginning of June, and has risen above the 200-day moving average MA(200). The price is rising after breaching above the resistance line. These are bullish developments.
- The Parabolic indicator has formed a buy signal.
- The Donchian channel indicates uptrend: it is tilted up.
- The MACD indicator is above the signal line with the gap widening. This is a bullish signal.
- The RSI oscillator is reaching overbought zone but has not yet breached into it.
We believe the bullish momentum will continue after the price breaches above the upper Donchian boundary at 5540.24. This level can be used as an entry point for placing a pending order to buy. The stop loss can be placed below the lower fractal at 5339.66. After placing the pending order the stop loss is to be moved every day to the next fractal low, following Parabolic signals. Thus, we are changing the expected profit/loss ratio to the breakeven point. If the price meets the stop-loss level (5339.66) without reaching the order (5540.24) we recommend cancelling the order: the market sustains internal changes which were not taken into account.
Technical Analysis Summary
| Order | Buy |
| Buy Stop | Above 5540.24 |
| Stop loss | Below 5339.66 |
- コースを取って、

【重要な注意事項】:
本レポートは、当社の親会社であるアイエフシーマーケットが作成したものの邦訳です。本レポートには、当社のサービスと商品についての情報を含みますが、お客様の投資目的、財務状況、資金力にかかわらず、情報の提供のみを目的とするものであり、金融商品の勧誘、取引の推奨、売買の提案等を意図したものではありません。 本レポートは、アイエフシーマーケットが信頼できると思われる情報にもとづき作成したものですが、次の点に十分ご留意ください。アイエフシーマーケットおよび当社は、本レポートが提供する情報、分析、予測、取引戦略等の正確性、確実性、完全性、安全性等について一切の保証をしません。アイエフシーマーケットおよび当社は、本レポートを参考にした投資行動が利益を生んだり損失を回避したりすることを保証または約束あるいは言外に暗示するものではありません。アイエフシーマーケットおよび当社は、本レポートに含まれる不確実性、不正確性、不完全性、誤謬、文章上の誤り等に起因して、お客様または第三者が損害(直接的か間接的かを問いません。)を被った場合でも、一切の責任を負いません。
